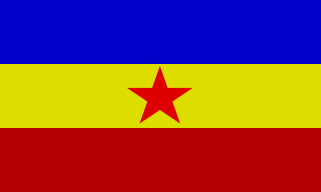
Nimbania Domestic Statistics
| Government Category: |
People's Republic |
| Government Priority: |
Defence |
| Economic Rating: |
Fair |
| Civil Rights Rating: |
Unheard Of |
| Political Freedoms: |
Rare |
| Income Tax Rate: |
32% |
| Consumer Confidence Rate: |
91% |
| Worker Enthusiasm Rate: |
91% |
| Major Industry: |
Arms Manufacturing |
| National Animal: |
Falcon |
|
Nimbania Demographics
| Total Population: |
21,480,000,000 |
| Criminals: |
2,630,726,140 |
| Elderly, Disabled, & Retirees: |
2,565,478,013 |
| Military & Reserves: ? |
755,507,735 |
| Students and Youth: |
3,849,216,000 |
| Unemployed but Able: |
3,440,440,145 |
| Working Class: |
8,238,631,967 |
|
|
|
Nimbania Government Budget Details
| Government Budget: |
$27,811,946,497,572.87 |
| Government Expenditures: |
$25,030,751,847,815.58 |
| Goverment Waste: |
$2,781,194,649,757.29 |
| Goverment Efficiency: |
90% |
|
Nimbania Government Spending Breakdown:
| Administration: |
$1,001,230,073,912.62 |
4% |
| Social Welfare: |
$3,003,690,221,737.87 |
12% |
| Healthcare: |
$2,002,460,147,825.25 |
8% |
| Education: |
$3,003,690,221,737.87 |
12% |
| Religion & Spirituality: |
$1,752,152,629,347.09 |
7% |
| Defense: |
$3,504,305,258,694.18 |
14% |
| Law & Order: |
$3,003,690,221,737.87 |
12% |
| Commerce: |
$1,501,845,110,868.93 |
6% |
| Public Transport: |
$3,504,305,258,694.18 |
14% |
| The Environment: |
$500,615,036,956.31 |
2% |
| Social Equality: |
$1,752,152,629,347.09 |
7% |
|
|
|
Nimbania White Market Statistics ?
| Gross Domestic Product: |
$19,457,300,000,000.00 |
| GDP Per Capita: |
$905.83 |
| Average Salary Per Employee: |
$1,271.23 |
| Unemployment Rate: |
25.23% |
| Consumption: |
$48,446,041,929,809.92 |
| Exports: |
$9,079,421,075,456.00 |
| Imports: |
$10,093,203,554,304.00 |
| Trade Net: |
-1,013,782,478,848.00 |
|
Nimbania Grey and Black Market Statistics ?
Evasion, Black Market, Barter & Crime
| Black & Grey Markets Combined: |
$78,216,208,035,274.45 |
| Avg Annual Criminal's Income / Savings: ? |
$2,382.36 |
| Recovered Product + Fines & Fees: |
$7,039,458,723,174.70 |
|
Black Market & Grey Market Statistics:
| Guns & Weapons: |
$3,194,946,334,746.88 |
| Drugs and Pharmaceuticals: |
$3,549,940,371,940.97 |
| Extortion & Blackmail: |
$2,028,537,355,394.84 |
| Counterfeit Goods: |
$5,071,343,388,487.11 |
| Trafficking & Intl Sales: |
$3,752,794,107,480.46 |
| Theft & Disappearance: |
$3,042,806,033,092.26 |
| Counterfeit Currency & Instruments : |
$4,665,635,917,408.14 |
| Illegal Mining, Logging, and Hunting : |
$1,825,683,619,855.36 |
| Basic Necessitites : |
$4,361,355,314,098.91 |
| School Loan Fraud : |
$2,637,098,562,013.30 |
| Tax Evasion + Barter Trade : |
$33,632,969,455,168.02 |
|
|
|
Nimbania Total Market Statistics ?
| National Currency: |
Denar |
| Exchange Rates: |
1 Denar = $0.09 |
| |
$1 = 10.56 Denars |
| |
Regional Exchange Rates |
| Gross Domestic Product: |
$19,457,300,000,000.00 - 20% |
| Black & Grey Markets Combined: |
$78,216,208,035,274.45 - 80% |
| Real Total Economy: |
$97,673,508,035,274.45 |
|