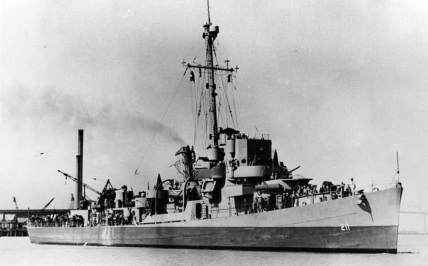
USS Hubbard Domestic Statistics
| Government Category: |
Constitutional Monarchy |
| Government Priority: |
Defence |
| Economic Rating: |
Good |
| Civil Rights Rating: |
Good |
| Political Freedoms: |
Good |
| Income Tax Rate: |
20% |
| Consumer Confidence Rate: |
101% |
| Worker Enthusiasm Rate: |
103% |
| Major Industry: |
Automobile Manufacturing |
| National Animal: |
Kitsune |
|
USS Hubbard Demographics
| Total Population: |
1,773,000,000 |
| Criminals: |
196,578,196 |
| Elderly, Disabled, & Retirees: |
241,848,500 |
| Military & Reserves: ? |
67,879,755 |
| Students and Youth: |
301,410,000 |
| Unemployed but Able: |
278,943,801 |
| Working Class: |
686,339,748 |
|
|
|
USS Hubbard Government Budget Details
| Government Budget: |
$4,342,627,943,684.51 |
| Government Expenditures: |
$4,168,922,825,937.13 |
| Goverment Waste: |
$173,705,117,747.38 |
| Goverment Efficiency: |
96% |
|
USS Hubbard Government Spending Breakdown:
| Administration: |
$416,892,282,593.71 |
10% |
| Social Welfare: |
$458,581,510,853.08 |
11% |
| Healthcare: |
$458,581,510,853.08 |
11% |
| Education: |
$416,892,282,593.71 |
10% |
| Religion & Spirituality: |
$125,067,684,778.11 |
3% |
| Defense: |
$625,338,423,890.57 |
15% |
| Law & Order: |
$625,338,423,890.57 |
15% |
| Commerce: |
$166,756,913,037.49 |
4% |
| Public Transport: |
$416,892,282,593.71 |
10% |
| The Environment: |
$166,756,913,037.49 |
4% |
| Social Equality: |
$208,446,141,296.86 |
5% |
|
|
|
USS Hubbard White Market Statistics ?
| Gross Domestic Product: |
$3,615,980,000,000.00 |
| GDP Per Capita: |
$2,039.47 |
| Average Salary Per Employee: |
$3,562.53 |
| Unemployment Rate: |
24.04% |
| Consumption: |
$11,075,307,175,936.00 |
| Exports: |
$1,887,513,699,584.00 |
| Imports: |
$1,886,693,621,760.00 |
| Trade Net: |
820,077,824.00 |
|
USS Hubbard Grey and Black Market Statistics ?
Evasion, Black Market, Barter & Crime
| Black & Grey Markets Combined: |
$4,369,718,145,036.85 |
| Avg Annual Criminal's Income / Savings: ? |
$1,852.41 |
| Recovered Product + Fines & Fees: |
$491,593,291,316.65 |
|
Black Market & Grey Market Statistics:
| Guns & Weapons: |
$174,079,329,371.37 |
| Drugs and Pharmaceuticals: |
$193,421,477,079.30 |
| Extortion & Blackmail: |
$154,737,181,663.44 |
| Counterfeit Goods: |
$292,895,379,577.22 |
| Trafficking & Intl Sales: |
$149,210,853,746.89 |
| Theft & Disappearance: |
$176,842,493,329.64 |
| Counterfeit Currency & Instruments : |
$359,211,314,575.83 |
| Illegal Mining, Logging, and Hunting : |
$99,473,902,497.92 |
| Basic Necessitites : |
$204,474,132,912.40 |
| School Loan Fraud : |
$132,631,869,997.23 |
| Tax Evasion + Barter Trade : |
$1,878,978,802,365.84 |
|
|
|
USS Hubbard Total Market Statistics ?
| National Currency: |
Delta Eagle |
| Exchange Rates: |
1 Delta Eagle = $0.19 |
| |
$1 = 5.14 Delta Eagles |
| |
Regional Exchange Rates |
| Gross Domestic Product: |
$3,615,980,000,000.00 - 45% |
| Black & Grey Markets Combined: |
$4,369,718,145,036.85 - 55% |
| Real Total Economy: |
$7,985,698,145,036.85 |
|


