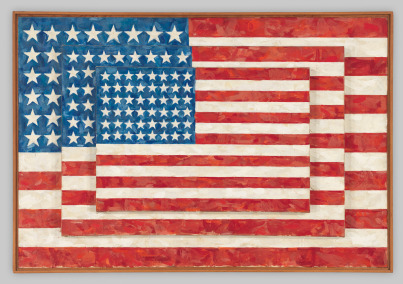
Three Flags Domestic Statistics
| Government Category: |
Republic |
| Government Priority: |
Law & Order |
| Economic Rating: |
Powerhouse |
| Civil Rights Rating: |
Some |
| Political Freedoms: |
Good |
| Income Tax Rate: |
46% |
| Consumer Confidence Rate: |
100% |
| Worker Enthusiasm Rate: |
102% |
| Major Industry: |
Arms Manufacturing |
| National Animal: |
Player |
|
Three Flags Demographics
| Total Population: |
409,000,000 |
| Criminals: |
33,821,131 |
| Elderly, Disabled, & Retirees: |
48,931,063 |
| Military & Reserves: ? |
13,929,890 |
| Students and Youth: |
76,728,400 |
| Unemployed but Able: |
56,048,715 |
| Working Class: |
179,540,802 |
|
|
|
Three Flags Government Budget Details
| Government Budget: |
$5,872,558,643,525.71 |
| Government Expenditures: |
$5,637,656,297,784.69 |
| Goverment Waste: |
$234,902,345,741.03 |
| Goverment Efficiency: |
96% |
|
Three Flags Government Spending Breakdown:
| Administration: |
$620,142,192,756.32 |
11% |
| Social Welfare: |
$0.00 |
0% |
| Healthcare: |
$451,012,503,822.78 |
8% |
| Education: |
$676,518,755,734.16 |
12% |
| Religion & Spirituality: |
$56,376,562,977.85 |
1% |
| Defense: |
$676,518,755,734.16 |
12% |
| Law & Order: |
$958,401,570,623.40 |
17% |
| Commerce: |
$732,895,318,712.01 |
13% |
| Public Transport: |
$507,389,066,800.62 |
9% |
| The Environment: |
$56,376,562,977.85 |
1% |
| Social Equality: |
$563,765,629,778.47 |
10% |
|
|
|
Three Flags White Market Statistics ?
| Gross Domestic Product: |
$4,611,930,000,000.00 |
| GDP Per Capita: |
$11,276.11 |
| Average Salary Per Employee: |
$17,030.72 |
| Unemployment Rate: |
15.53% |
| Consumption: |
$5,641,868,893,224.96 |
| Exports: |
$1,345,472,425,984.00 |
| Imports: |
$1,409,994,719,232.00 |
| Trade Net: |
-64,522,293,248.00 |
|
Three Flags Grey and Black Market Statistics ?
Evasion, Black Market, Barter & Crime
| Black & Grey Markets Combined: |
$14,749,777,574,395.85 |
| Avg Annual Criminal's Income / Savings: ? |
$35,982.78 |
| Recovered Product + Fines & Fees: |
$1,880,596,640,735.47 |
|
Black Market & Grey Market Statistics:
| Guns & Weapons: |
$449,295,279,346.42 |
| Drugs and Pharmaceuticals: |
$531,818,902,083.52 |
| Extortion & Blackmail: |
$880,251,975,862.37 |
| Counterfeit Goods: |
$1,320,377,963,793.55 |
| Trafficking & Intl Sales: |
$366,771,656,609.32 |
| Theft & Disappearance: |
$660,188,981,896.78 |
| Counterfeit Currency & Instruments : |
$1,247,023,632,471.69 |
| Illegal Mining, Logging, and Hunting : |
$201,724,411,135.13 |
| Basic Necessitites : |
$403,448,822,270.25 |
| School Loan Fraud : |
$458,464,570,761.65 |
| Tax Evasion + Barter Trade : |
$6,342,404,356,990.22 |
|
|
|
Three Flags Total Market Statistics ?
| National Currency: |
Games |
| Exchange Rates: |
1 Games = $0.84 |
| |
$1 = 1.20 Gamess |
| |
Regional Exchange Rates |
| Gross Domestic Product: |
$4,611,930,000,000.00 - 24% |
| Black & Grey Markets Combined: |
$14,749,777,574,395.85 - 76% |
| Real Total Economy: |
$19,361,707,574,395.85 |
|