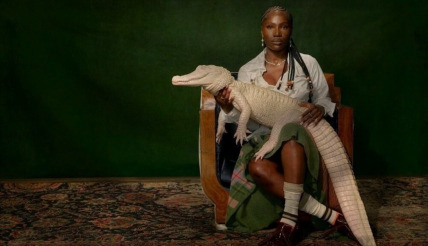
The Swamp Queen Domestic Statistics
| Government Category: |
Matriarchy |
| Government Priority: |
Social Welfare |
| Economic Rating: |
Basket Case |
| Civil Rights Rating: |
Very Good |
| Political Freedoms: |
Superb |
| Income Tax Rate: |
58% |
| Consumer Confidence Rate: |
97% |
| Worker Enthusiasm Rate: |
99% |
| Major Industry: |
Trout Farming |
| National Animal: |
Alligator |
|
The Swamp Queen Demographics
| Total Population: |
26,000,000 |
| Criminals: |
2,989,841 |
| Elderly, Disabled, & Retirees: |
2,883,667 |
| Military & Reserves: ? |
452,498 |
| Students and Youth: |
5,140,200 |
| Unemployed but Able: |
4,212,533 |
| Working Class: |
10,321,260 |
|
|
|
The Swamp Queen Government Budget Details
| Government Budget: |
$6,024,324,597.62 |
| Government Expenditures: |
$5,903,838,105.66 |
| Goverment Waste: |
$120,486,491.95 |
| Goverment Efficiency: |
98% |
|
The Swamp Queen Government Spending Breakdown:
| Administration: |
$413,268,667.40 |
7% |
| Social Welfare: |
$885,575,715.85 |
15% |
| Healthcare: |
$708,460,572.68 |
12% |
| Education: |
$767,498,953.74 |
13% |
| Religion & Spirituality: |
$531,345,429.51 |
9% |
| Defense: |
$413,268,667.40 |
7% |
| Law & Order: |
$649,422,191.62 |
11% |
| Commerce: |
$177,115,143.17 |
3% |
| Public Transport: |
$413,268,667.40 |
7% |
| The Environment: |
$236,153,524.23 |
4% |
| Social Equality: |
$413,268,667.40 |
7% |
|
|
|
The Swamp Queen White Market Statistics ?
| Gross Domestic Product: |
$4,760,940,000.00 |
| GDP Per Capita: |
$183.11 |
| Average Salary Per Employee: |
$287.93 |
| Unemployment Rate: |
26.00% |
| Consumption: |
$3,679,164,088.32 |
| Exports: |
$1,108,237,648.00 |
| Imports: |
$1,234,988,032.00 |
| Trade Net: |
-126,750,384.00 |
|
The Swamp Queen Grey and Black Market Statistics ?
Evasion, Black Market, Barter & Crime
| Black & Grey Markets Combined: |
$15,673,804,066.48 |
| Avg Annual Criminal's Income / Savings: ? |
$390.06 |
| Recovered Product + Fines & Fees: |
$1,293,088,835.48 |
|
Black Market & Grey Market Statistics:
| Guns & Weapons: |
$379,111,605.28 |
| Drugs and Pharmaceuticals: |
$942,655,883.39 |
| Extortion & Blackmail: |
$409,850,384.08 |
| Counterfeit Goods: |
$717,238,172.15 |
| Trafficking & Intl Sales: |
$553,298,018.51 |
| Theft & Disappearance: |
$778,715,729.76 |
| Counterfeit Currency & Instruments : |
$881,178,325.78 |
| Illegal Mining, Logging, and Hunting : |
$307,387,788.06 |
| Basic Necessitites : |
$1,024,625,960.21 |
| School Loan Fraud : |
$614,775,576.13 |
| Tax Evasion + Barter Trade : |
$6,739,735,748.59 |
|
|
|
The Swamp Queen Total Market Statistics ?
| National Currency: |
dollar |
| Exchange Rates: |
1 dollar = $0.01 |
| |
$1 = 79.40 dollars |
| |
Regional Exchange Rates |
| Gross Domestic Product: |
$4,760,940,000.00 - 23% |
| Black & Grey Markets Combined: |
$15,673,804,066.48 - 77% |
| Real Total Economy: |
$20,434,744,066.48 |
|


