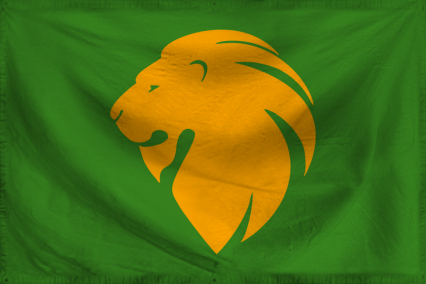
The African Empire Domestic Statistics
| Government Category: |
Federated Kingdoms |
| Government Priority: |
Defence |
| Economic Rating: |
Powerhouse |
| Civil Rights Rating: |
Excellent |
| Political Freedoms: |
Few |
| Income Tax Rate: |
10% |
| Consumer Confidence Rate: |
105% |
| Worker Enthusiasm Rate: |
105% |
| Major Industry: |
Trout Farming |
| National Animal: |
lion |
|
The African Empire Demographics
| Total Population: |
3,309,000,000 |
| Criminals: |
351,708,085 |
| Elderly, Disabled, & Retirees: |
447,519,080 |
| Military & Reserves: ? |
183,713,513 |
| Students and Youth: |
552,603,000 |
| Unemployed but Able: |
499,126,079 |
| Working Class: |
1,274,330,243 |
|
|
|
The African Empire Government Budget Details
| Government Budget: |
$19,411,109,083,611.14 |
| Government Expenditures: |
$17,858,220,356,922.25 |
| Goverment Waste: |
$1,552,888,726,688.89 |
| Goverment Efficiency: |
92% |
|
The African Empire Government Spending Breakdown:
| Administration: |
$2,321,568,646,399.89 |
13% |
| Social Welfare: |
$1,964,404,239,261.45 |
11% |
| Healthcare: |
$1,785,822,035,692.22 |
10% |
| Education: |
$2,500,150,849,969.11 |
14% |
| Religion & Spirituality: |
$178,582,203,569.22 |
1% |
| Defense: |
$3,750,226,274,953.67 |
21% |
| Law & Order: |
$1,964,404,239,261.45 |
11% |
| Commerce: |
$1,785,822,035,692.22 |
10% |
| Public Transport: |
$714,328,814,276.89 |
4% |
| The Environment: |
$535,746,610,707.67 |
3% |
| Social Equality: |
$357,164,407,138.45 |
2% |
|
|
|
The African Empire White Market Statistics ?
| Gross Domestic Product: |
$15,729,400,000,000.00 |
| GDP Per Capita: |
$4,753.52 |
| Average Salary Per Employee: |
$8,845.49 |
| Unemployment Rate: |
21.32% |
| Consumption: |
$82,115,150,059,929.61 |
| Exports: |
$11,597,679,624,192.00 |
| Imports: |
$11,901,683,630,080.00 |
| Trade Net: |
-304,004,005,888.00 |
|
The African Empire Grey and Black Market Statistics ?
Evasion, Black Market, Barter & Crime
| Black & Grey Markets Combined: |
$15,271,868,187,020.46 |
| Avg Annual Criminal's Income / Savings: ? |
$3,692.35 |
| Recovered Product + Fines & Fees: |
$1,259,929,125,429.19 |
|
Black Market & Grey Market Statistics:
| Guns & Weapons: |
$848,598,059,417.62 |
| Drugs and Pharmaceuticals: |
$698,845,460,696.87 |
| Extortion & Blackmail: |
$918,482,605,487.31 |
| Counterfeit Goods: |
$1,257,921,829,254.36 |
| Trafficking & Intl Sales: |
$239,604,157,953.21 |
| Theft & Disappearance: |
$479,208,315,906.42 |
| Counterfeit Currency & Instruments : |
$1,377,723,908,230.96 |
| Illegal Mining, Logging, and Hunting : |
$199,670,131,627.68 |
| Basic Necessitites : |
$758,746,500,185.17 |
| School Loan Fraud : |
$618,977,408,045.79 |
| Tax Evasion + Barter Trade : |
$6,566,903,320,418.80 |
|
|
|
The African Empire Total Market Statistics ?
| National Currency: |
denarius |
| Exchange Rates: |
1 denarius = $0.54 |
| |
$1 = 1.84 denariuss |
| |
Regional Exchange Rates |
| Gross Domestic Product: |
$15,729,400,000,000.00 - 51% |
| Black & Grey Markets Combined: |
$15,271,868,187,020.46 - 49% |
| Real Total Economy: |
$31,001,268,187,020.46 |
|


