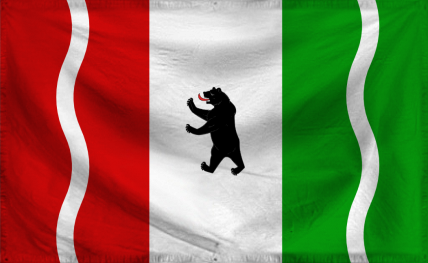
South Baltic Domestic Statistics
| Government Category: |
Kingdom |
| Government Priority: |
Religion & Spirituality |
| Economic Rating: |
Good |
| Civil Rights Rating: |
Few |
| Political Freedoms: |
Rare |
| Income Tax Rate: |
38% |
| Consumer Confidence Rate: |
96% |
| Worker Enthusiasm Rate: |
95% |
| Major Industry: |
Beef-Based Agriculture |
| National Animal: |
Black Bear |
|
South Baltic Demographics
| Total Population: |
9,000,000 |
| Criminals: |
1,058,896 |
| Elderly, Disabled, & Retirees: |
1,080,628 |
| Military & Reserves: ? |
276,280 |
| Students and Youth: |
1,611,000 |
| Unemployed but Able: |
1,412,255 |
| Working Class: |
3,560,941 |
|
|
|
South Baltic Government Budget Details
| Government Budget: |
$27,734,780,981.15 |
| Government Expenditures: |
$24,961,302,883.03 |
| Goverment Waste: |
$2,773,478,098.11 |
| Goverment Efficiency: |
90% |
|
South Baltic Government Spending Breakdown:
| Administration: |
$1,497,678,172.98 |
6% |
| Social Welfare: |
$2,995,356,345.96 |
12% |
| Healthcare: |
$2,246,517,259.47 |
9% |
| Education: |
$2,496,130,288.30 |
10% |
| Religion & Spirituality: |
$4,992,260,576.61 |
20% |
| Defense: |
$2,995,356,345.96 |
12% |
| Law & Order: |
$3,244,969,374.79 |
13% |
| Commerce: |
$748,839,086.49 |
3% |
| Public Transport: |
$1,497,678,172.98 |
6% |
| The Environment: |
$748,839,086.49 |
3% |
| Social Equality: |
$998,452,115.32 |
4% |
|
|
|
South Baltic White Market Statistics ?
| Gross Domestic Product: |
$19,856,300,000.00 |
| GDP Per Capita: |
$2,206.26 |
| Average Salary Per Employee: |
$3,305.53 |
| Unemployment Rate: |
23.86% |
| Consumption: |
$38,231,480,647.68 |
| Exports: |
$7,809,878,848.00 |
| Imports: |
$8,228,487,168.00 |
| Trade Net: |
-418,608,320.00 |
|
South Baltic Grey and Black Market Statistics ?
Evasion, Black Market, Barter & Crime
| Black & Grey Markets Combined: |
$77,823,221,993.80 |
| Avg Annual Criminal's Income / Savings: ? |
$5,832.91 |
| Recovered Product + Fines & Fees: |
$7,587,764,144.40 |
|
Black Market & Grey Market Statistics:
| Guns & Weapons: |
$3,402,907,932.80 |
| Drugs and Pharmaceuticals: |
$4,804,105,316.90 |
| Extortion & Blackmail: |
$1,801,539,493.84 |
| Counterfeit Goods: |
$4,403,763,207.16 |
| Trafficking & Intl Sales: |
$3,502,993,460.24 |
| Theft & Disappearance: |
$2,602,223,713.32 |
| Counterfeit Currency & Instruments : |
$5,004,276,371.77 |
| Illegal Mining, Logging, and Hunting : |
$1,201,026,329.22 |
| Basic Necessitites : |
$3,803,250,042.55 |
| School Loan Fraud : |
$2,301,967,131.01 |
| Tax Evasion + Barter Trade : |
$33,463,985,457.33 |
|
|
|
South Baltic Total Market Statistics ?
| National Currency: |
Euro |
| Exchange Rates: |
1 Euro = $0.20 |
| |
$1 = 4.94 Euros |
| |
Regional Exchange Rates |
| Gross Domestic Product: |
$19,856,300,000.00 - 20% |
| Black & Grey Markets Combined: |
$77,823,221,993.80 - 80% |
| Real Total Economy: |
$97,679,521,993.80 |
|


