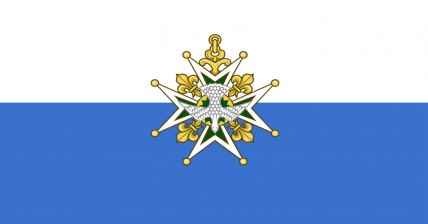
Mistersap and Krajola Domestic Statistics
| Government Category: |
Grand Republic |
| Government Priority: |
Defence |
| Economic Rating: |
Frightening |
| Civil Rights Rating: |
Some |
| Political Freedoms: |
Some |
| Income Tax Rate: |
51% |
| Consumer Confidence Rate: |
102% |
| Worker Enthusiasm Rate: |
101% |
| Major Industry: |
Arms Manufacturing |
| National Animal: |
fox |
|
Mistersap and Krajola Demographics
| Total Population: |
3,521,000,000 |
| Criminals: |
249,665,306 |
| Elderly, Disabled, & Retirees: |
433,783,553 |
| Military & Reserves: ? |
303,541,721 |
| Students and Youth: |
644,166,950 |
| Unemployed but Able: |
448,891,541 |
| Working Class: |
1,440,950,929 |
|
|
|
Mistersap and Krajola Government Budget Details
| Government Budget: |
$76,199,558,885,345.84 |
| Government Expenditures: |
$71,627,585,352,225.09 |
| Goverment Waste: |
$4,571,973,533,120.75 |
| Goverment Efficiency: |
94% |
|
Mistersap and Krajola Government Spending Breakdown:
| Administration: |
$10,744,137,802,833.76 |
15% |
| Social Welfare: |
$0.00 |
0% |
| Healthcare: |
$4,297,655,121,133.51 |
6% |
| Education: |
$6,446,482,681,700.26 |
9% |
| Religion & Spirituality: |
$716,275,853,522.25 |
1% |
| Defense: |
$20,771,999,752,145.28 |
29% |
| Law & Order: |
$17,906,896,338,056.27 |
25% |
| Commerce: |
$7,162,758,535,222.51 |
10% |
| Public Transport: |
$2,148,827,560,566.75 |
3% |
| The Environment: |
$1,432,551,707,044.50 |
2% |
| Social Equality: |
$0.00 |
0% |
|
|
|
Mistersap and Krajola White Market Statistics ?
| Gross Domestic Product: |
$58,810,600,000,000.00 |
| GDP Per Capita: |
$16,702.81 |
| Average Salary Per Employee: |
$27,330.11 |
| Unemployment Rate: |
11.53% |
| Consumption: |
$62,331,968,070,615.04 |
| Exports: |
$16,575,544,934,400.00 |
| Imports: |
$16,417,300,676,608.00 |
| Trade Net: |
158,244,257,792.00 |
|
Mistersap and Krajola Grey and Black Market Statistics ?
Evasion, Black Market, Barter & Crime
| Black & Grey Markets Combined: |
$201,166,306,965,487.28 |
| Avg Annual Criminal's Income / Savings: ? |
$88,349.12 |
| Recovered Product + Fines & Fees: |
$37,718,682,556,028.87 |
|
Black Market & Grey Market Statistics:
| Guns & Weapons: |
$13,625,402,589,833.47 |
| Drugs and Pharmaceuticals: |
$5,124,083,025,236.52 |
| Extortion & Blackmail: |
$11,645,643,239,173.91 |
| Counterfeit Goods: |
$23,058,373,613,564.34 |
| Trafficking & Intl Sales: |
$2,096,215,783,051.30 |
| Theft & Disappearance: |
$2,794,954,377,401.74 |
| Counterfeit Currency & Instruments : |
$25,387,502,261,399.13 |
| Illegal Mining, Logging, and Hunting : |
$1,630,390,053,484.35 |
| Basic Necessitites : |
$2,096,215,783,051.30 |
| School Loan Fraud : |
$4,658,257,295,669.56 |
| Tax Evasion + Barter Trade : |
$86,501,511,995,159.53 |
|
|
|
Mistersap and Krajola Total Market Statistics ?
| National Currency: |
Pound |
| Exchange Rates: |
1 Pound = $1.20 |
| |
$1 = 0.83 Pounds |
| |
Regional Exchange Rates |
| Gross Domestic Product: |
$58,810,600,000,000.00 - 23% |
| Black & Grey Markets Combined: |
$201,166,306,965,487.28 - 77% |
| Real Total Economy: |
$259,976,906,965,487.28 |
|


