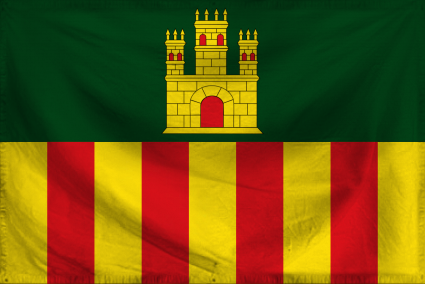
Lower Garraf Domestic Statistics
| Government Category: |
Free Land |
| Government Priority: |
Education |
| Economic Rating: |
Good |
| Civil Rights Rating: |
Excellent |
| Political Freedoms: |
Superb |
| Income Tax Rate: |
60% |
| Consumer Confidence Rate: |
103% |
| Worker Enthusiasm Rate: |
106% |
| Major Industry: |
Tourism |
| National Animal: |
genetta |
|
Lower Garraf Demographics
| Total Population: |
29,000,000 |
| Criminals: |
2,897,876 |
| Elderly, Disabled, & Retirees: |
2,486,724 |
| Military & Reserves: ? |
842,883 |
| Students and Youth: |
6,467,000 |
| Unemployed but Able: |
4,377,439 |
| Working Class: |
11,928,078 |
|
|
|
Lower Garraf Government Budget Details
| Government Budget: |
$170,151,552,927.50 |
| Government Expenditures: |
$166,748,521,868.95 |
| Goverment Waste: |
$3,403,031,058.55 |
| Goverment Efficiency: |
98% |
|
Lower Garraf Government Spending Breakdown:
| Administration: |
$15,007,366,968.21 |
9% |
| Social Welfare: |
$18,342,337,405.58 |
11% |
| Healthcare: |
$18,342,337,405.58 |
11% |
| Education: |
$35,017,189,592.48 |
21% |
| Religion & Spirituality: |
$1,667,485,218.69 |
1% |
| Defense: |
$18,342,337,405.58 |
11% |
| Law & Order: |
$15,007,366,968.21 |
9% |
| Commerce: |
$15,007,366,968.21 |
9% |
| Public Transport: |
$10,004,911,312.14 |
6% |
| The Environment: |
$8,337,426,093.45 |
5% |
| Social Equality: |
$11,672,396,530.83 |
7% |
|
|
|
Lower Garraf White Market Statistics ?
| Gross Domestic Product: |
$136,507,000,000.00 |
| GDP Per Capita: |
$4,707.14 |
| Average Salary Per Employee: |
$8,121.59 |
| Unemployment Rate: |
21.36% |
| Consumption: |
$95,201,663,385.60 |
| Exports: |
$30,110,472,960.00 |
| Imports: |
$31,791,734,784.00 |
| Trade Net: |
-1,681,261,824.00 |
|
Lower Garraf Grey and Black Market Statistics ?
Evasion, Black Market, Barter & Crime
| Black & Grey Markets Combined: |
$219,484,200,490.16 |
| Avg Annual Criminal's Income / Savings: ? |
$5,737.85 |
| Recovered Product + Fines & Fees: |
$14,815,183,533.09 |
|
Black Market & Grey Market Statistics:
| Guns & Weapons: |
$6,562,200,356.19 |
| Drugs and Pharmaceuticals: |
$12,832,747,363.21 |
| Extortion & Blackmail: |
$10,499,520,569.90 |
| Counterfeit Goods: |
$13,707,707,410.70 |
| Trafficking & Intl Sales: |
$5,249,760,284.95 |
| Theft & Disappearance: |
$10,499,520,569.90 |
| Counterfeit Currency & Instruments : |
$13,707,707,410.70 |
| Illegal Mining, Logging, and Hunting : |
$4,666,453,586.62 |
| Basic Necessitites : |
$14,582,667,458.19 |
| School Loan Fraud : |
$13,707,707,410.70 |
| Tax Evasion + Barter Trade : |
$94,378,206,210.77 |
|
|
|
Lower Garraf Total Market Statistics ?
| National Currency: |
garrafian croat |
| Exchange Rates: |
1 garrafian croat = $0.30 |
| |
$1 = 3.38 garrafian croats |
| |
Regional Exchange Rates |
| Gross Domestic Product: |
$136,507,000,000.00 - 38% |
| Black & Grey Markets Combined: |
$219,484,200,490.16 - 62% |
| Real Total Economy: |
$355,991,200,490.16 |
|


