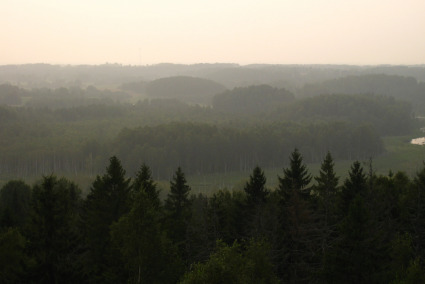
Karula National Park Domestic Statistics
| Government Category: |
Federation |
| Government Priority: |
Defence |
| Economic Rating: |
Powerhouse |
| Civil Rights Rating: |
Rare |
| Political Freedoms: |
Few |
| Income Tax Rate: |
49% |
| Consumer Confidence Rate: |
0% |
| Worker Enthusiasm Rate: |
0% |
| Major Industry: |
Arms Manufacturing |
| National Animal: |
gamble |
|
Karula National Park Demographics
| Total Population: |
3,448,000,000 |
| Criminals: |
inf |
| Elderly, Disabled, & Retirees: |
0 |
| Military & Reserves: ? |
136,793,194 |
| Students and Youth: |
644,603,600 |
| Unemployed but Able: |
560,280,874 |
| Working Class: |
1,288,135,906 |
|
|
|
Karula National Park Government Budget Details
| Government Budget: |
$0.00 |
| Government Expenditures: |
$0.00 |
| Goverment Waste: |
$0.00 |
| Goverment Efficiency: |
0% |
|
Karula National Park Government Spending Breakdown:
| Administration: |
$0.00 |
10% |
| Social Welfare: |
$0.00 |
5% |
| Healthcare: |
$0.00 |
10% |
| Education: |
$0.00 |
11% |
| Religion & Spirituality: |
$0.00 |
4% |
| Defense: |
$0.00 |
16% |
| Law & Order: |
$0.00 |
15% |
| Commerce: |
$0.00 |
12% |
| Public Transport: |
$0.00 |
5% |
| The Environment: |
$0.00 |
4% |
| Social Equality: |
$0.00 |
7% |
|
|
|
Karula National Park White Market Statistics ?
| Gross Domestic Product: |
$0.00 |
| GDP Per Capita: |
$0.00 |
| Average Salary Per Employee: |
$0.00 |
| Unemployment Rate: |
26.20% |
| Consumption: |
$0.00 |
| Exports: |
$0.00 |
| Imports: |
$0.00 |
| Trade Net: |
0.00 |
|
Karula National Park Grey and Black Market Statistics ?
Evasion, Black Market, Barter & Crime
| Black & Grey Markets Combined: |
$nan |
| Avg Annual Criminal's Income / Savings: ? |
$nan |
| Recovered Product + Fines & Fees: |
$nan |
|
Black Market & Grey Market Statistics:
| Guns & Weapons: |
$nan |
| Drugs and Pharmaceuticals: |
$nan |
| Extortion & Blackmail: |
$nan |
| Counterfeit Goods: |
$nan |
| Trafficking & Intl Sales: |
$nan |
| Theft & Disappearance: |
$nan |
| Counterfeit Currency & Instruments : |
$nan |
| Illegal Mining, Logging, and Hunting : |
$nan |
| Basic Necessitites : |
$nan |
| School Loan Fraud : |
$nan |
| Tax Evasion + Barter Trade : |
$nan |
|
|
|
Karula National Park Total Market Statistics ?
| National Currency: |
gamble |
| Gross Domestic Product: |
$0.00 - nan% |
| Black & Grey Markets Combined: |
$nan - nan% |
| Real Total Economy: |
$nan |
|


