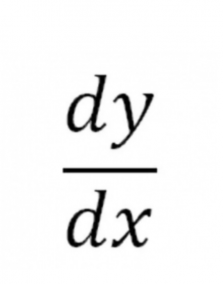
Explicit Differentiation Domestic Statistics
| Government Category: |
Math State |
| Government Priority: |
Education |
| Economic Rating: |
Powerhouse |
| Civil Rights Rating: |
Some |
| Political Freedoms: |
Rare |
| Income Tax Rate: |
32% |
| Consumer Confidence Rate: |
100% |
| Worker Enthusiasm Rate: |
98% |
| Major Industry: |
Information Technology |
| National Animal: |
Graphs |
|
Explicit Differentiation Demographics
| Total Population: |
7,955,000,000 |
| Criminals: |
800,194,496 |
| Elderly, Disabled, & Retirees: |
889,426,354 |
| Military & Reserves: ? |
367,896,799 |
| Students and Youth: |
1,501,904,000 |
| Unemployed but Able: |
1,156,643,785 |
| Working Class: |
3,238,934,565 |
|
|
|
Explicit Differentiation Government Budget Details
| Government Budget: |
$78,064,217,454,595.30 |
| Government Expenditures: |
$70,257,795,709,135.77 |
| Goverment Waste: |
$7,806,421,745,459.53 |
| Goverment Efficiency: |
90% |
|
Explicit Differentiation Government Spending Breakdown:
| Administration: |
$6,323,201,613,822.22 |
9% |
| Social Welfare: |
$1,405,155,914,182.72 |
2% |
| Healthcare: |
$4,918,045,699,639.50 |
7% |
| Education: |
$12,646,403,227,644.44 |
18% |
| Religion & Spirituality: |
$0.00 |
0% |
| Defense: |
$11,943,825,270,553.08 |
17% |
| Law & Order: |
$11,241,247,313,461.72 |
16% |
| Commerce: |
$10,538,669,356,370.37 |
15% |
| Public Transport: |
$2,107,733,871,274.07 |
3% |
| The Environment: |
$4,215,467,742,548.15 |
6% |
| Social Equality: |
$3,512,889,785,456.79 |
5% |
|
|
|
Explicit Differentiation White Market Statistics ?
| Gross Domestic Product: |
$57,154,900,000,000.00 |
| GDP Per Capita: |
$7,184.78 |
| Average Salary Per Employee: |
$11,240.63 |
| Unemployment Rate: |
19.03% |
| Consumption: |
$132,692,583,099,924.48 |
| Exports: |
$24,755,166,576,640.00 |
| Imports: |
$25,369,390,350,336.00 |
| Trade Net: |
-614,223,773,696.00 |
|
Explicit Differentiation Grey and Black Market Statistics ?
Evasion, Black Market, Barter & Crime
| Black & Grey Markets Combined: |
$202,942,573,362,995.53 |
| Avg Annual Criminal's Income / Savings: ? |
$21,788.36 |
| Recovered Product + Fines & Fees: |
$24,353,108,803,559.46 |
|
Black Market & Grey Market Statistics:
| Guns & Weapons: |
$8,652,659,557,904.68 |
| Drugs and Pharmaceuticals: |
$8,143,679,583,910.28 |
| Extortion & Blackmail: |
$12,215,519,375,865.43 |
| Counterfeit Goods: |
$20,104,708,972,778.52 |
| Trafficking & Intl Sales: |
$3,053,879,843,966.36 |
| Theft & Disappearance: |
$6,107,759,687,932.71 |
| Counterfeit Currency & Instruments : |
$17,050,829,128,812.16 |
| Illegal Mining, Logging, and Hunting : |
$3,817,349,804,957.95 |
| Basic Necessitites : |
$6,871,229,648,924.30 |
| School Loan Fraud : |
$10,688,579,453,882.25 |
| Tax Evasion + Barter Trade : |
$87,265,306,546,088.08 |
|
|
|
Explicit Differentiation Total Market Statistics ?
| National Currency: |
Mathkoruna |
| Exchange Rates: |
1 Mathkoruna = $0.67 |
| |
$1 = 1.50 Mathkorunas |
| |
Regional Exchange Rates |
| Gross Domestic Product: |
$57,154,900,000,000.00 - 22% |
| Black & Grey Markets Combined: |
$202,942,573,362,995.53 - 78% |
| Real Total Economy: |
$260,097,473,362,995.53 |
|


