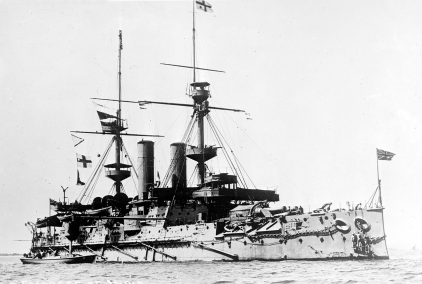
Empress of India Domestic Statistics
| Government Category: |
Kingdom |
| Government Priority: |
Law & Order |
| Economic Rating: |
Good |
| Civil Rights Rating: |
Good |
| Political Freedoms: |
Good |
| Income Tax Rate: |
17% |
| Consumer Confidence Rate: |
101% |
| Worker Enthusiasm Rate: |
103% |
| Major Industry: |
Basket Weaving |
| National Animal: |
Kitsune |
|
Empress of India Demographics
| Total Population: |
1,767,000,000 |
| Criminals: |
196,956,592 |
| Elderly, Disabled, & Retirees: |
243,649,844 |
| Military & Reserves: ? |
67,491,254 |
| Students and Youth: |
297,739,500 |
| Unemployed but Able: |
278,751,246 |
| Working Class: |
682,411,564 |
|
|
|
Empress of India Government Budget Details
| Government Budget: |
$3,929,807,522,428.35 |
| Government Expenditures: |
$3,772,615,221,531.22 |
| Goverment Waste: |
$157,192,300,897.13 |
| Goverment Efficiency: |
96% |
|
Empress of India Government Spending Breakdown:
| Administration: |
$377,261,522,153.12 |
10% |
| Social Welfare: |
$414,987,674,368.43 |
11% |
| Healthcare: |
$414,987,674,368.43 |
11% |
| Education: |
$377,261,522,153.12 |
10% |
| Religion & Spirituality: |
$113,178,456,645.94 |
3% |
| Defense: |
$565,892,283,229.68 |
15% |
| Law & Order: |
$565,892,283,229.68 |
15% |
| Commerce: |
$150,904,608,861.25 |
4% |
| Public Transport: |
$377,261,522,153.12 |
10% |
| The Environment: |
$150,904,608,861.25 |
4% |
| Social Equality: |
$188,630,761,076.56 |
5% |
|
|
|
Empress of India White Market Statistics ?
| Gross Domestic Product: |
$3,300,410,000,000.00 |
| GDP Per Capita: |
$1,867.80 |
| Average Salary Per Employee: |
$3,270.34 |
| Unemployment Rate: |
24.22% |
| Consumption: |
$11,449,523,461,160.96 |
| Exports: |
$1,880,761,119,232.00 |
| Imports: |
$1,883,951,726,592.00 |
| Trade Net: |
-3,190,607,360.00 |
|
Empress of India Grey and Black Market Statistics ?
Evasion, Black Market, Barter & Crime
| Black & Grey Markets Combined: |
$3,703,490,447,960.28 |
| Avg Annual Criminal's Income / Savings: ? |
$1,566.97 |
| Recovered Product + Fines & Fees: |
$416,642,675,395.53 |
|
Black Market & Grey Market Statistics:
| Guns & Weapons: |
$147,538,379,391.00 |
| Drugs and Pharmaceuticals: |
$163,931,532,656.67 |
| Extortion & Blackmail: |
$131,145,226,125.33 |
| Counterfeit Goods: |
$248,239,178,022.95 |
| Trafficking & Intl Sales: |
$126,461,468,049.43 |
| Theft & Disappearance: |
$149,880,258,428.95 |
| Counterfeit Currency & Instruments : |
$304,444,274,933.81 |
| Illegal Mining, Logging, and Hunting : |
$84,307,645,366.29 |
| Basic Necessitites : |
$173,299,048,808.48 |
| School Loan Fraud : |
$112,410,193,821.72 |
| Tax Evasion + Barter Trade : |
$1,592,500,892,622.92 |
|
|
|
Empress of India Total Market Statistics ?
| National Currency: |
Delta Eagle |
| Exchange Rates: |
1 Delta Eagle = $0.19 |
| |
$1 = 5.37 Delta Eagles |
| |
Regional Exchange Rates |
| Gross Domestic Product: |
$3,300,410,000,000.00 - 47% |
| Black & Grey Markets Combined: |
$3,703,490,447,960.28 - 53% |
| Real Total Economy: |
$7,003,900,447,960.28 |
|


