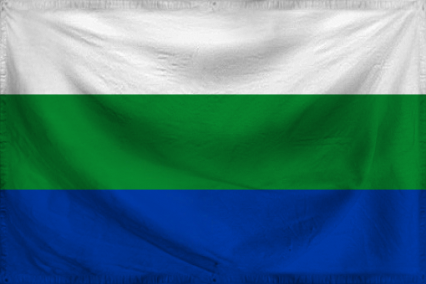
The Federation of Trans-Siberia
Съ нами Богъ!
Region: Lazarus
Quicksearch Query: Trans-Siberia
|
Quicksearch: | |
NS Economy Mobile Home |
Regions Search |
Trans-Siberia NS Page |
|
| GDP Leaders | Export Leaders | Interesting Places BIG Populations | Most Worked | | Militaristic States | Police States | |
| Trans-Siberia Domestic Statistics | |||
|---|---|---|---|
| Government Category: | Federation | ||
| Government Priority: | Social Welfare | ||
| Economic Rating: | Reasonable | ||
| Civil Rights Rating: | Frightening | ||
| Political Freedoms: | Corrupted | ||
| Income Tax Rate: | 12% | ||
| Consumer Confidence Rate: | 97% | ||
| Worker Enthusiasm Rate: | 99% | ||
| Major Industry: | Retail | ||
| National Animal: | bear | ||
| Trans-Siberia Demographics | |||
| Total Population: | 871,000,000 | ||
| Criminals: | 113,732,834 | ||
| Elderly, Disabled, & Retirees: | 103,914,491 | ||
| Military & Reserves: ? | 43,624,019 | ||
| Students and Youth: | 149,812,000 | ||
| Unemployed but Able: | 140,007,182 | ||
| Working Class: | 319,909,474 | ||
| Trans-Siberia Government Budget Details | |||
| Government Budget: | $859,717,825,737.52 | ||
| Government Expenditures: | $730,760,151,876.90 | ||
| Goverment Waste: | $128,957,673,860.63 | ||
| Goverment Efficiency: | 85% | ||
| Trans-Siberia Government Spending Breakdown: | |||
| Administration: | $14,615,203,037.54 | 2% | |
| Social Welfare: | $241,150,850,119.38 | 33% | |
| Healthcare: | $109,614,022,781.53 | 15% | |
| Education: | $146,152,030,375.38 | 20% | |
| Religion & Spirituality: | $0.00 | 0% | |
| Defense: | $146,152,030,375.38 | 20% | |
| Law & Order: | $43,845,609,112.61 | 6% | |
| Commerce: | $0.00 | 0% | |
| Public Transport: | $14,615,203,037.54 | 2% | |
| The Environment: | $0.00 | 0% | |
| Social Equality: | $14,615,203,037.54 | 2% | |
| Trans-SiberiaWhite Market Economic Statistics ? | |||
| Gross Domestic Product: | $592,791,000,000.00 | ||
| GDP Per Capita: | $680.59 | ||
| Average Salary Per Employee: | $1,156.63 | ||
| Unemployment Rate: | 25.47% | ||
| Consumption: | $3,681,740,673,515.52 | ||
| Exports: | $531,066,679,296.00 | ||
| Imports: | $568,625,135,616.00 | ||
| Trade Net: | -37,558,456,320.00 | ||
| Trans-Siberia Non Market Statistics ? Evasion, Black Market, Barter & Crime | |||
| Black & Grey Markets Combined: | $1,736,964,761,937.61 | ||
| Avg Annual Criminal's Income / Savings: ? | $1,223.74 | ||
| Recovered Product + Fines & Fees: | $78,163,414,287.19 | ||
| Black Market & Non Monetary Trade: | |||
| Guns & Weapons: | $94,551,676,816.07 | ||
| Drugs and Pharmaceuticals: | $118,189,596,020.09 | ||
| Extortion & Blackmail: | $9,455,167,681.61 | ||
| Counterfeit Goods: | $75,641,341,452.86 | ||
| Trafficking & Intl Sales: | $9,455,167,681.61 | ||
| Theft & Disappearance: | $80,368,925,293.66 | ||
| Counterfeit Currency & Instruments : | $85,096,509,134.47 | ||
| Illegal Mining, Logging, and Hunting : | $4,727,583,840.80 | ||
| Basic Necessitites : | $208,013,688,995.36 | ||
| School Loan Fraud : | $94,551,676,816.07 | ||
| Tax Evasion + Barter Trade : | $746,894,847,633.17 | ||
| Trans-Siberia Total Market Statistics ? | |||
| National Currency: | Trans-Siberian ruble | ||
| Exchange Rates: | 1 Trans-Siberian ruble = $0.09 | ||
| $1 = 10.90 Trans-Siberian rubles | |||
| Regional Exchange Rates | |||
| Gross Domestic Product: | $592,791,000,000.00 - 25% | ||
| Black & Grey Markets Combined: | $1,736,964,761,937.61 - 75% | ||
| Real Total Economy: | $2,329,755,761,937.61 | ||
| Lazarus Economic Statistics & Links | |||
| Gross Regional Product: | $1,447,275,885,647,364,096 | ||
| Region Wide Imports: | $183,708,756,410,892,288 | ||
| Largest Regional GDP: | Bereza | ||
| Largest Regional Importer: | Bereza | ||
| Regional Search Functions: | All Lazarus Nations. | ||
| Regional Nations by GDP | Regional Trading Leaders | |||
| Regional Exchange Rates | WA Members | |||
| Returns to standard Version: | FAQ | About | About | 483,719,800 uses since September 1, 2011. | |
Version 3.69 HTML4. V 0.7 is HTML1. |
Like our Calculator? Tell your friends for us... |