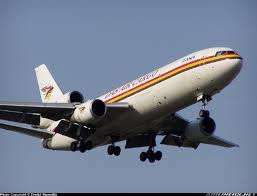
The Airplanes of T-A-E
For all, for the fleet!
|
Quicksearch: | |
NS Economy Mobile Home |
Regions Search |
T-A-E NS Page |
|
| GDP Leaders | Export Leaders | Interesting Places BIG Populations | Most Worked | | Militaristic States | Police States | |
| T-A-E Domestic Statistics | |||
|---|---|---|---|
| Government Category: | Airplanes | ||
| Government Priority: | Social Equality | ||
| Economic Rating: | Very Strong | ||
| Civil Rights Rating: | Below Average | ||
| Political Freedoms: | Corrupted | ||
| Income Tax Rate: | 9% | ||
| Consumer Confidence Rate: | 100% | ||
| Worker Enthusiasm Rate: | 101% | ||
| Major Industry: | Trout Farming | ||
| National Animal: | seagull | ||
| T-A-E Demographics | |||
| Total Population: | 30,308,000,000 | ||
| Criminals: | 3,789,732,293 | ||
| Elderly, Disabled, & Retirees: | 3,907,716,854 | ||
| Military & Reserves: ? | 387,029,289 | ||
| Students and Youth: | 4,944,750,200 | ||
| Unemployed but Able: | 4,764,824,337 | ||
| Working Class: | 12,513,947,026 | ||
| T-A-E Government Budget Details | |||
| Government Budget: | $84,043,469,597,913.91 | ||
| Government Expenditures: | $71,436,949,158,226.81 | ||
| Goverment Waste: | $12,606,520,439,687.09 | ||
| Goverment Efficiency: | 85% | ||
| T-A-E Government Spending Breakdown: | |||
| Administration: | $3,571,847,457,911.34 | 5% | |
| Social Welfare: | $3,571,847,457,911.34 | 5% | |
| Healthcare: | $1,428,738,983,164.54 | 2% | |
| Education: | $5,000,586,441,075.88 | 7% | |
| Religion & Spirituality: | $10,001,172,882,151.75 | 14% | |
| Defense: | $3,571,847,457,911.34 | 5% | |
| Law & Order: | $12,858,650,848,480.83 | 18% | |
| Commerce: | $7,858,064,407,404.95 | 11% | |
| Public Transport: | $3,571,847,457,911.34 | 5% | |
| The Environment: | $3,571,847,457,911.34 | 5% | |
| Social Equality: | $15,001,759,323,227.63 | 21% | |
| T-A-EWhite Market Economic Statistics ? | |||
| Gross Domestic Product: | $63,226,500,000,000.00 | ||
| GDP Per Capita: | $2,086.13 | ||
| Average Salary Per Employee: | $3,316.95 | ||
| Unemployment Rate: | 23.99% | ||
| Consumption: | $418,006,735,446,343.69 | ||
| Exports: | $61,238,697,582,592.00 | ||
| Imports: | $61,180,873,801,728.00 | ||
| Trade Net: | 57,823,780,864.00 | ||
| T-A-E Non Market Statistics ? Evasion, Black Market, Barter & Crime | |||
| Black & Grey Markets Combined: | $142,701,600,633,162.22 | ||
| Avg Annual Criminal's Income / Savings: ? | $2,932.62 | ||
| Recovered Product + Fines & Fees: | $19,264,716,085,476.90 | ||
| Black Market & Non Monetary Trade: | |||
| Guns & Weapons: | $2,990,258,528,167.68 | ||
| Drugs and Pharmaceuticals: | $4,397,439,012,011.29 | ||
| Extortion & Blackmail: | $5,628,721,935,374.45 | ||
| Counterfeit Goods: | $11,081,546,310,268.45 | ||
| Trafficking & Intl Sales: | $5,101,029,253,933.09 | ||
| Theft & Disappearance: | $8,091,287,782,100.77 | ||
| Counterfeit Currency & Instruments : | $8,970,775,584,503.03 | ||
| Illegal Mining, Logging, and Hunting : | $2,638,463,407,206.77 | ||
| Basic Necessitites : | $6,684,107,298,257.16 | ||
| School Loan Fraud : | $3,342,053,649,128.58 | ||
| Tax Evasion + Barter Trade : | $61,361,688,272,259.75 | ||
| T-A-E Total Market Statistics ? | |||
| National Currency: | Atlan | ||
| Exchange Rates: | 1 Atlan = $0.28 | ||
| $1 = 3.59 Atlans | |||
| Regional Exchange Rates | |||
| Gross Domestic Product: | $63,226,500,000,000.00 - 31% | ||
| Black & Grey Markets Combined: | $142,701,600,633,162.22 - 69% | ||
| Real Total Economy: | $205,928,100,633,162.22 | ||
| Route 66 Economic Statistics & Links | |||
| Gross Regional Product: | $481,785,674,727,424 | ||
| Region Wide Imports: | $64,230,002,786,304 | ||
| Largest Regional GDP: | T-A-E | ||
| Largest Regional Importer: | T-A-E | ||
| Regional Search Functions: | All Route 66 Nations. | ||
| Regional Nations by GDP | Regional Trading Leaders | |||
| Regional Exchange Rates | WA Members | |||
| Returns to standard Version: | FAQ | About | About | 671,358,541 uses since September 1, 2011. | |
Version 3.69 HTML4. V 0.7 is HTML1. |
Like our Calculator? Tell your friends for us... |