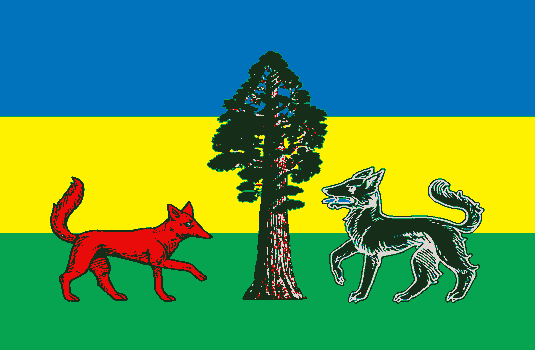
The Protectorate of Puusanamaa
Puolustamme ja suojelemme!
Region: Europe
Quicksearch Query: Puusanamaa
|
Quicksearch: | |
NS Economy Mobile Home |
Regions Search |
Puusanamaa NS Page |
|
| GDP Leaders | Export Leaders | Interesting Places BIG Populations | Most Worked | | Militaristic States | Police States | |

Puolustamme ja suojelemme!
Region: Europe
Quicksearch Query: Puusanamaa
| Puusanamaa Domestic Statistics | |||
|---|---|---|---|
| Government Category: | Protectorate | ||
| Government Priority: | Education | ||
| Economic Rating: | All-Consuming | ||
| Civil Rights Rating: | Excellent | ||
| Political Freedoms: | Average | ||
| Income Tax Rate: | 93% | ||
| Consumer Confidence Rate: | 106% | ||
| Worker Enthusiasm Rate: | 108% | ||
| Major Industry: | Information Technology | ||
| National Animal: | vuorikoira | ||
| Puusanamaa Demographics | |||
| Total Population: | 34,721,000,000 | ||
| Criminals: | 1,749,380,340 | ||
| Elderly, Disabled, & Retirees: | 2,077,593,974 | ||
| Military & Reserves: ? | 219,847,608 | ||
| Students and Youth: | 8,622,960,350 | ||
| Unemployed but Able: | 3,950,431,345 | ||
| Working Class: | 18,100,786,384 | ||
| Puusanamaa Government Budget Details | |||
| Government Budget: | $1,221,161,189,901,965.75 | ||
| Government Expenditures: | $1,172,314,742,305,887.00 | ||
| Goverment Waste: | $48,846,447,596,078.75 | ||
| Goverment Efficiency: | 96% | ||
| Puusanamaa Government Spending Breakdown: | |||
| Administration: | $82,062,031,961,412.09 | 7% | |
| Social Welfare: | $140,677,769,076,706.44 | 12% | |
| Healthcare: | $152,400,916,499,765.31 | 13% | |
| Education: | $222,739,801,038,118.53 | 19% | |
| Religion & Spirituality: | $0.00 | 0% | |
| Defense: | $23,446,294,846,117.74 | 2% | |
| Law & Order: | $58,615,737,115,294.35 | 5% | |
| Commerce: | $82,062,031,961,412.09 | 7% | |
| Public Transport: | $93,785,179,384,470.97 | 8% | |
| The Environment: | $140,677,769,076,706.44 | 12% | |
| Social Equality: | $140,677,769,076,706.44 | 12% | |
| PuusanamaaWhite Market Economic Statistics ? | |||
| Gross Domestic Product: | $952,551,000,000,000.00 | ||
| GDP Per Capita: | $27,434.43 | ||
| Average Salary Per Employee: | $39,159.20 | ||
| Unemployment Rate: | 5.78% | ||
| Consumption: | $83,765,760,517,734.41 | ||
| Exports: | $150,948,941,398,016.00 | ||
| Imports: | $148,135,049,428,992.00 | ||
| Trade Net: | 2,813,891,969,024.00 | ||
| Puusanamaa Non Market Statistics ? Evasion, Black Market, Barter & Crime | |||
| Black & Grey Markets Combined: | $1,752,280,820,111,513.50 | ||
| Avg Annual Criminal's Income / Savings: ? | $67,863.01 | ||
| Recovered Product + Fines & Fees: | $65,710,530,754,181.77 | ||
| Black Market & Non Monetary Trade: | |||
| Guns & Weapons: | $9,613,450,649,336.79 | ||
| Drugs and Pharmaceuticals: | $108,151,319,805,038.89 | ||
| Extortion & Blackmail: | $67,294,154,545,357.54 | ||
| Counterfeit Goods: | $62,487,429,220,689.13 | ||
| Trafficking & Intl Sales: | $67,294,154,545,357.54 | ||
| Theft & Disappearance: | $120,168,133,116,709.88 | ||
| Counterfeit Currency & Instruments : | $62,487,429,220,689.13 | ||
| Illegal Mining, Logging, and Hunting : | $76,907,605,194,694.33 | ||
| Basic Necessitites : | $132,184,946,428,380.88 | ||
| School Loan Fraud : | $120,168,133,116,709.88 | ||
| Tax Evasion + Barter Trade : | $753,480,752,647,950.75 | ||
| Puusanamaa Total Market Statistics ? | |||
| National Currency: | raha | ||
| Exchange Rates: | 1 raha = $1.43 | ||
| $1 = 0.70 rahas | |||
| Regional Exchange Rates | |||
| Gross Domestic Product: | $952,551,000,000,000.00 - 35% | ||
| Black & Grey Markets Combined: | $1,752,280,820,111,513.50 - 65% | ||
| Real Total Economy: | $2,704,831,820,111,513.50 | ||
| Europe Economic Statistics & Links | |||
| Gross Regional Product: | $240,176,821,755,183,104 | ||
| Region Wide Imports: | $30,296,514,622,390,272 | ||
| Largest Regional GDP: | Hirota | ||
| Largest Regional Importer: | Hirota | ||
| Regional Search Functions: | All Europe Nations. | ||
| Regional Nations by GDP | Regional Trading Leaders | |||
| Regional Exchange Rates | WA Members | |||
| Returns to standard Version: | FAQ | About | About | 559,117,627 uses since September 1, 2011. | |
Version 3.69 HTML4. V 0.7 is HTML1. |
Like our Calculator? Tell your friends for us... |