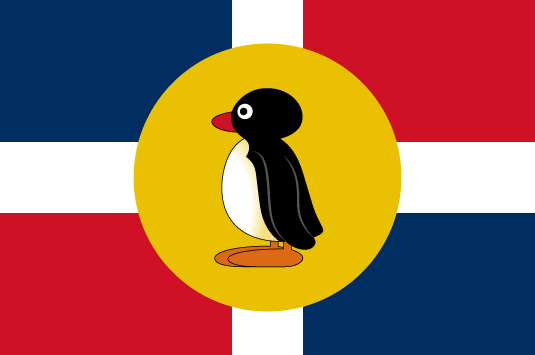
The Snowy yet delightful world of Pingu
NOOT NOOT!
Region: Antarctica
Quicksearch Query: Pingu
|
Quicksearch: | |
NS Economy Mobile Home |
Regions Search |
Pingu NS Page |
|
| GDP Leaders | Export Leaders | Interesting Places BIG Populations | Most Worked | | Militaristic States | Police States | |
| Pingu Domestic Statistics | |||
|---|---|---|---|
| Government Category: | Snowy yet delightful world | ||
| Government Priority: | Education | ||
| Economic Rating: | Very Strong | ||
| Civil Rights Rating: | Frightening | ||
| Political Freedoms: | Corrupted | ||
| Income Tax Rate: | 14% | ||
| Consumer Confidence Rate: | 99% | ||
| Worker Enthusiasm Rate: | 101% | ||
| Major Industry: | Pizza Delivery | ||
| National Animal: | fish | ||
| Pingu Demographics | |||
| Total Population: | 14,801,000,000 | ||
| Criminals: | 1,834,855,604 | ||
| Elderly, Disabled, & Retirees: | 1,677,461,346 | ||
| Military & Reserves: ? | 569,158,758 | ||
| Students and Youth: | 2,647,898,900 | ||
| Unemployed but Able: | 2,316,797,947 | ||
| Working Class: | 5,754,827,445 | ||
| Pingu Government Budget Details | |||
| Government Budget: | $49,891,977,247,431.07 | ||
| Government Expenditures: | $42,408,180,660,316.41 | ||
| Goverment Waste: | $7,483,796,587,114.66 | ||
| Goverment Efficiency: | 85% | ||
| Pingu Government Spending Breakdown: | |||
| Administration: | $2,968,572,646,222.15 | 7% | |
| Social Welfare: | $2,120,409,033,015.82 | 5% | |
| Healthcare: | $5,088,981,679,237.97 | 12% | |
| Education: | $11,450,208,778,285.43 | 27% | |
| Religion & Spirituality: | $0.00 | 0% | |
| Defense: | $6,361,227,099,047.46 | 15% | |
| Law & Order: | $848,163,613,206.33 | 2% | |
| Commerce: | $0.00 | 0% | |
| Public Transport: | $6,361,227,099,047.46 | 15% | |
| The Environment: | $6,361,227,099,047.46 | 15% | |
| Social Equality: | $848,163,613,206.33 | 2% | |
| PinguWhite Market Economic Statistics ? | |||
| Gross Domestic Product: | $34,988,100,000,000.00 | ||
| GDP Per Capita: | $2,363.90 | ||
| Average Salary Per Employee: | $3,951.46 | ||
| Unemployment Rate: | 23.70% | ||
| Consumption: | $191,027,215,461,253.12 | ||
| Exports: | $28,273,893,834,752.00 | ||
| Imports: | $29,474,471,018,496.00 | ||
| Trade Net: | -1,200,577,183,744.00 | ||
| Pingu Non Market Statistics ? Evasion, Black Market, Barter & Crime | |||
| Black & Grey Markets Combined: | $105,686,281,891,553.22 | ||
| Avg Annual Criminal's Income / Savings: ? | $4,247.73 | ||
| Recovered Product + Fines & Fees: | $1,585,294,228,373.30 | ||
| Black Market & Non Monetary Trade: | |||
| Guns & Weapons: | $4,450,317,222,600.94 | ||
| Drugs and Pharmaceuticals: | $7,565,539,278,421.60 | ||
| Extortion & Blackmail: | $2,076,814,703,880.44 | ||
| Counterfeit Goods: | $2,818,534,240,980.60 | ||
| Trafficking & Intl Sales: | $6,675,475,833,901.41 | ||
| Theft & Disappearance: | $4,153,629,407,760.88 | ||
| Counterfeit Currency & Instruments : | $4,895,348,944,861.04 | ||
| Illegal Mining, Logging, and Hunting : | $6,675,475,833,901.41 | ||
| Basic Necessitites : | $5,785,412,389,381.22 | ||
| School Loan Fraud : | $10,235,729,611,982.16 | ||
| Tax Evasion + Barter Trade : | $45,445,101,213,367.88 | ||
| Pingu Total Market Statistics ? | |||
| National Currency: | Minoan tala | ||
| Exchange Rates: | 1 Minoan tala = $0.30 | ||
| $1 = 3.38 Minoan talas | |||
| Regional Exchange Rates | |||
| Gross Domestic Product: | $34,988,100,000,000.00 - 25% | ||
| Black & Grey Markets Combined: | $105,686,281,891,553.22 - 75% | ||
| Real Total Economy: | $140,674,381,891,553.22 | ||
| Antarctica Economic Statistics & Links | |||
| Gross Regional Product: | $29,560,271,328,509,952 | ||
| Region Wide Imports: | $3,762,679,650,975,744 | ||
| Largest Regional GDP: | Toneor | ||
| Largest Regional Importer: | Mercobia | ||
| Regional Search Functions: | All Antarctica Nations. | ||
| Regional Nations by GDP | Regional Trading Leaders | |||
| Regional Exchange Rates | WA Members | |||
| Returns to standard Version: | FAQ | About | About | 596,972,996 uses since September 1, 2011. | |
Version 3.69 HTML4. V 0.7 is HTML1. |
Like our Calculator? Tell your friends for us... |