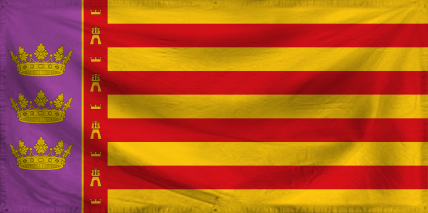
The Arling of Naraj
Dra Myf ec dra Myf
Region: Bridgetown
Quicksearch Query: Naraj
|
Quicksearch: | |
NS Economy Mobile Home |
Regions Search |
Naraj NS Page |
|
| GDP Leaders | Export Leaders | Interesting Places BIG Populations | Most Worked | | Militaristic States | Police States | |
| Naraj Domestic Statistics | |||
|---|---|---|---|
| Government Category: | Arling | ||
| Government Priority: | Religion & Spirituality | ||
| Economic Rating: | Strong | ||
| Civil Rights Rating: | Good | ||
| Political Freedoms: | Superb | ||
| Income Tax Rate: | 32% | ||
| Consumer Confidence Rate: | 102% | ||
| Worker Enthusiasm Rate: | 105% | ||
| Major Industry: | Trout Farming | ||
| National Animal: | panther | ||
| Naraj Demographics | |||
| Total Population: | 9,024,000,000 | ||
| Criminals: | 924,071,629 | ||
| Elderly, Disabled, & Retirees: | 1,139,968,532 | ||
| Military & Reserves: ? | 354,188,663 | ||
| Students and Youth: | 1,645,977,600 | ||
| Unemployed but Able: | 1,378,552,647 | ||
| Working Class: | 3,581,240,928 | ||
| Naraj Government Budget Details | |||
| Government Budget: | $42,504,115,315,288.31 | ||
| Government Expenditures: | $41,654,033,008,982.55 | ||
| Goverment Waste: | $850,082,306,305.77 | ||
| Goverment Efficiency: | 98% | ||
| Naraj Government Spending Breakdown: | |||
| Administration: | $2,499,241,980,538.95 | 6% | |
| Social Welfare: | $5,831,564,621,257.56 | 14% | |
| Healthcare: | $3,748,862,970,808.43 | 9% | |
| Education: | $5,831,564,621,257.56 | 14% | |
| Religion & Spirituality: | $7,081,185,611,527.03 | 17% | |
| Defense: | $6,248,104,951,347.38 | 15% | |
| Law & Order: | $3,748,862,970,808.43 | 9% | |
| Commerce: | $2,082,701,650,449.13 | 5% | |
| Public Transport: | $2,082,701,650,449.13 | 5% | |
| The Environment: | $416,540,330,089.83 | 1% | |
| Social Equality: | $1,666,161,320,359.30 | 4% | |
| NarajWhite Market Economic Statistics ? | |||
| Gross Domestic Product: | $35,451,200,000,000.00 | ||
| GDP Per Capita: | $3,928.55 | ||
| Average Salary Per Employee: | $6,891.29 | ||
| Unemployment Rate: | 22.12% | ||
| Consumption: | $65,795,095,244,308.48 | ||
| Exports: | $13,157,724,453,888.00 | ||
| Imports: | $13,168,127,508,480.00 | ||
| Trade Net: | -10,403,054,592.00 | ||
| Naraj Non Market Statistics ? Evasion, Black Market, Barter & Crime | |||
| Black & Grey Markets Combined: | $47,614,397,554,171.84 | ||
| Avg Annual Criminal's Income / Savings: ? | $4,050.84 | ||
| Recovered Product + Fines & Fees: | $3,213,971,834,906.60 | ||
| Black Market & Non Monetary Trade: | |||
| Guns & Weapons: | $2,435,918,356,023.19 | ||
| Drugs and Pharmaceuticals: | $3,100,259,725,847.70 | ||
| Extortion & Blackmail: | $1,391,953,346,298.97 | ||
| Counterfeit Goods: | $2,720,636,085,947.98 | ||
| Trafficking & Intl Sales: | $1,771,576,986,198.68 | ||
| Theft & Disappearance: | $1,645,035,772,898.78 | ||
| Counterfeit Currency & Instruments : | $2,847,177,299,247.88 | ||
| Illegal Mining, Logging, and Hunting : | $442,894,246,549.67 | ||
| Basic Necessitites : | $2,910,447,905,897.84 | ||
| School Loan Fraud : | $1,834,847,592,848.64 | ||
| Tax Evasion + Barter Trade : | $20,474,190,948,293.89 | ||
| Naraj Total Market Statistics ? | |||
| National Currency: | kama | ||
| Exchange Rates: | 1 kama = $0.31 | ||
| $1 = 3.21 kamas | |||
| Regional Exchange Rates | |||
| Gross Domestic Product: | $35,451,200,000,000.00 - 43% | ||
| Black & Grey Markets Combined: | $47,614,397,554,171.84 - 57% | ||
| Real Total Economy: | $83,065,597,554,171.84 | ||
| Bridgetown Economic Statistics & Links | |||
| Gross Regional Product: | $3,616,393,064,873,984 | ||
| Region Wide Imports: | $491,781,070,258,176 | ||
| Largest Regional GDP: | Spoletium | ||
| Largest Regional Importer: | Spoletium | ||
| Regional Search Functions: | All Bridgetown Nations. | ||
| Regional Nations by GDP | Regional Trading Leaders | |||
| Regional Exchange Rates | WA Members | |||
| Returns to standard Version: | FAQ | About | About | 594,150,611 uses since September 1, 2011. | |
Version 3.69 HTML4. V 0.7 is HTML1. |
Like our Calculator? Tell your friends for us... |