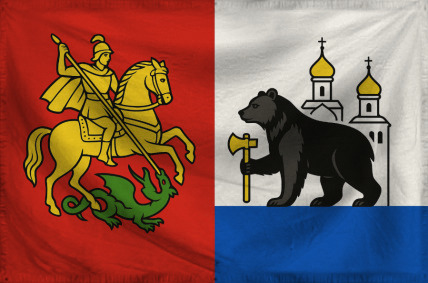
The Principality of Moscow-Novgorod
We are better
Region: the South Pacific
Quicksearch Query: Moscow-Novgorod
|
Quicksearch: | |
NS Economy Mobile Home |
Regions Search |
Moscow-Novgorod NS Page |
|
| GDP Leaders | Export Leaders | Interesting Places BIG Populations | Most Worked | | Militaristic States | Police States | |

We are better
Region: the South Pacific
Quicksearch Query: Moscow-Novgorod
| Moscow-Novgorod Domestic Statistics | |||
|---|---|---|---|
| Government Category: | Principality | ||
| Government Priority: | Law & Order | ||
| Economic Rating: | Weak | ||
| Civil Rights Rating: | Few | ||
| Political Freedoms: | Some | ||
| Income Tax Rate: | 70% | ||
| Consumer Confidence Rate: | 94% | ||
| Worker Enthusiasm Rate: | 94% | ||
| Major Industry: | Arms Manufacturing | ||
| National Animal: | Bear | ||
| Moscow-Novgorod Demographics | |||
| Total Population: | 6,000,000 | ||
| Criminals: | 701,205 | ||
| Elderly, Disabled, & Retirees: | 674,201 | ||
| Military & Reserves: ? | 196,267 | ||
| Students and Youth: | 1,149,000 | ||
| Unemployed but Able: | 959,349 | ||
| Working Class: | 2,319,977 | ||
| Moscow-Novgorod Government Budget Details | |||
| Government Budget: | $8,172,299,568.08 | ||
| Government Expenditures: | $7,681,961,593.99 | ||
| Goverment Waste: | $490,337,974.08 | ||
| Goverment Efficiency: | 94% | ||
| Moscow-Novgorod Government Spending Breakdown: | |||
| Administration: | $614,556,927.52 | 8% | |
| Social Welfare: | $460,917,695.64 | 6% | |
| Healthcare: | $614,556,927.52 | 8% | |
| Education: | $691,376,543.46 | 9% | |
| Religion & Spirituality: | $691,376,543.46 | 9% | |
| Defense: | $998,655,007.22 | 13% | |
| Law & Order: | $1,075,474,623.16 | 14% | |
| Commerce: | $384,098,079.70 | 5% | |
| Public Transport: | $614,556,927.52 | 8% | |
| The Environment: | $460,917,695.64 | 6% | |
| Social Equality: | $537,737,311.58 | 7% | |
| Moscow-NovgorodWhite Market Economic Statistics ? | |||
| Gross Domestic Product: | $6,092,360,000.00 | ||
| GDP Per Capita: | $1,015.39 | ||
| Average Salary Per Employee: | $1,508.24 | ||
| Unemployment Rate: | 25.11% | ||
| Consumption: | $3,190,435,123.20 | ||
| Exports: | $1,345,157,368.00 | ||
| Imports: | $1,445,884,928.00 | ||
| Trade Net: | -100,727,560.00 | ||
| Moscow-Novgorod Non Market Statistics ? Evasion, Black Market, Barter & Crime | |||
| Black & Grey Markets Combined: | $24,248,897,402.17 | ||
| Avg Annual Criminal's Income / Savings: ? | $2,797.88 | ||
| Recovered Product + Fines & Fees: | $2,546,134,227.23 | ||
| Black Market & Non Monetary Trade: | |||
| Guns & Weapons: | $943,256,344.49 | ||
| Drugs and Pharmaceuticals: | $1,051,498,875.83 | ||
| Extortion & Blackmail: | $804,087,375.63 | ||
| Counterfeit Goods: | $1,577,248,313.74 | ||
| Trafficking & Intl Sales: | $958,719,563.25 | ||
| Theft & Disappearance: | $927,793,125.73 | ||
| Counterfeit Currency & Instruments : | $1,762,806,938.88 | ||
| Illegal Mining, Logging, and Hunting : | $618,528,750.49 | ||
| Basic Necessitites : | $865,940,250.68 | ||
| School Loan Fraud : | $742,234,500.58 | ||
| Tax Evasion + Barter Trade : | $10,427,025,882.93 | ||
| Moscow-Novgorod Total Market Statistics ? | |||
| National Currency: | Denga | ||
| Exchange Rates: | 1 Denga = $0.07 | ||
| $1 = 14.10 Dengas | |||
| Regional Exchange Rates | |||
| Gross Domestic Product: | $6,092,360,000.00 - 20% | ||
| Black & Grey Markets Combined: | $24,248,897,402.17 - 80% | ||
| Real Total Economy: | $30,341,257,402.17 | ||
| the South Pacific Economic Statistics & Links | |||
| Gross Regional Product: | $358,476,765,301,047,296 | ||
| Region Wide Imports: | $45,342,498,024,849,408 | ||
| Largest Regional GDP: | United Earthlings | ||
| Largest Regional Importer: | Al-Khadhulu | ||
| Regional Search Functions: | All the South Pacific Nations. | ||
| Regional Nations by GDP | Regional Trading Leaders | |||
| Regional Exchange Rates | WA Members | |||
| Returns to standard Version: | FAQ | About | About | 580,194,158 uses since September 1, 2011. | |
Version 3.69 HTML4. V 0.7 is HTML1. |
Like our Calculator? Tell your friends for us... |