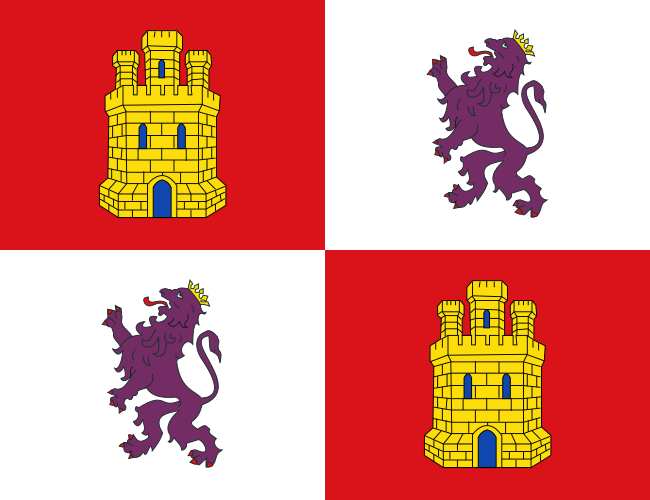
The Empire of Lobart
Um pa?s s? ? soberano,quando tem poder de fogo
|
Quicksearch: | |
NS Economy Mobile Home |
Regions Search |
Lobart NS Page |
|
| GDP Leaders | Export Leaders | Interesting Places BIG Populations | Most Worked | | Militaristic States | Police States | |
Um pa?s s? ? soberano,quando tem poder de fogo
| Lobart Domestic Statistics | |||
|---|---|---|---|
| Government Category: | Empire | ||
| Government Priority: | Law & Order | ||
| Economic Rating: | Strong | ||
| Civil Rights Rating: | Unheard Of | ||
| Political Freedoms: | Outlawed | ||
| Income Tax Rate: | 29% | ||
| Consumer Confidence Rate: | 93% | ||
| Worker Enthusiasm Rate: | 93% | ||
| Major Industry: | Trout Farming | ||
| National Animal: | Drag?o | ||
| Lobart Demographics | |||
| Total Population: | 20,000,000 | ||
| Criminals: | 2,688,121 | ||
| Elderly, Disabled, & Retirees: | 2,189,441 | ||
| Military & Reserves: ? | 863,896 | ||
| Students and Youth: | 3,490,000 | ||
| Unemployed but Able: | 3,162,873 | ||
| Working Class: | 7,605,669 | ||
| Lobart Government Budget Details | |||
| Government Budget: | $56,291,038,003.20 | ||
| Government Expenditures: | $45,032,830,402.56 | ||
| Goverment Waste: | $11,258,207,600.64 | ||
| Goverment Efficiency: | 80% | ||
| Lobart Government Spending Breakdown: | |||
| Administration: | $3,152,298,128.18 | 7% | |
| Social Welfare: | $5,854,267,952.33 | 13% | |
| Healthcare: | $4,503,283,040.26 | 10% | |
| Education: | $4,503,283,040.26 | 10% | |
| Religion & Spirituality: | $0.00 | 0% | |
| Defense: | $7,655,581,168.44 | 17% | |
| Law & Order: | $8,105,909,472.46 | 18% | |
| Commerce: | $3,602,626,432.20 | 8% | |
| Public Transport: | $3,152,298,128.18 | 7% | |
| The Environment: | $1,350,984,912.08 | 3% | |
| Social Equality: | $2,251,641,520.13 | 5% | |
| LobartWhite Market Economic Statistics ? | |||
| Gross Domestic Product: | $34,222,300,000.00 | ||
| GDP Per Capita: | $1,711.12 | ||
| Average Salary Per Employee: | $2,529.60 | ||
| Unemployment Rate: | 24.38% | ||
| Consumption: | $122,974,267,637.76 | ||
| Exports: | $21,817,254,784.00 | ||
| Imports: | $22,582,046,720.00 | ||
| Trade Net: | -764,791,936.00 | ||
| Lobart Non Market Statistics ? Evasion, Black Market, Barter & Crime | |||
| Black & Grey Markets Combined: | $181,205,702,324.01 | ||
| Avg Annual Criminal's Income / Savings: ? | $5,913.14 | ||
| Recovered Product + Fines & Fees: | $24,462,769,813.74 | ||
| Black Market & Non Monetary Trade: | |||
| Guns & Weapons: | $7,594,195,080.12 | ||
| Drugs and Pharmaceuticals: | $6,700,760,364.81 | ||
| Extortion & Blackmail: | $6,700,760,364.81 | ||
| Counterfeit Goods: | $15,411,748,839.07 | ||
| Trafficking & Intl Sales: | $3,797,097,540.06 | ||
| Theft & Disappearance: | $6,700,760,364.81 | ||
| Counterfeit Currency & Instruments : | $14,965,031,481.42 | ||
| Illegal Mining, Logging, and Hunting : | $2,903,662,824.75 | ||
| Basic Necessitites : | $9,157,705,831.91 | ||
| School Loan Fraud : | $5,137,249,613.02 | ||
| Tax Evasion + Barter Trade : | $77,918,451,999.32 | ||
| Lobart Total Market Statistics ? | |||
| National Currency: | denier | ||
| Exchange Rates: | 1 denier = $0.21 | ||
| $1 = 4.86 deniers | |||
| Regional Exchange Rates | |||
| Gross Domestic Product: | $34,222,300,000.00 - 16% | ||
| Black & Grey Markets Combined: | $181,205,702,324.01 - 84% | ||
| Real Total Economy: | $215,428,002,324.01 | ||
| Concord Economic Statistics & Links | |||
| Gross Regional Product: | $33,424,045,382,828,032 | ||
| Region Wide Imports: | $4,210,204,774,236,160 | ||
| Largest Regional GDP: | Dtoc | ||
| Largest Regional Importer: | Dtoc | ||
| Regional Search Functions: | All Concord Nations. | ||
| Regional Nations by GDP | Regional Trading Leaders | |||
| Regional Exchange Rates | WA Members | |||
| Returns to standard Version: | FAQ | About | About | 672,021,331 uses since September 1, 2011. | |
Version 3.69 HTML4. V 0.7 is HTML1. |
Like our Calculator? Tell your friends for us... |