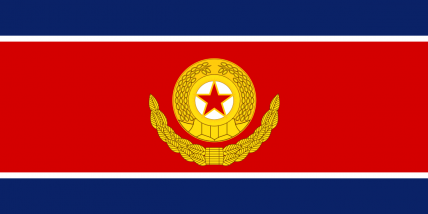
The Armed Forces of Zulankan Outpost 11
?Hasta la Victoria Siempre!
Region: Reichskommissariat Westindien
Quicksearch Query: Zulankan Outpost 11
|
Quicksearch: | |
NS Economy Mobile Home |
Regions Search |
Zulankan Outpost 11 NS Page |
|
| GDP Leaders | Export Leaders | Interesting Places BIG Populations | Most Worked | | Militaristic States | Police States | |

?Hasta la Victoria Siempre!
Region: Reichskommissariat Westindien
Quicksearch Query: Zulankan Outpost 11
| Zulankan Outpost 11 Domestic Statistics | |||
|---|---|---|---|
| Government Category: | Armed Forces | ||
| Government Priority: | Social Welfare | ||
| Economic Rating: | Basket Case | ||
| Civil Rights Rating: | Average | ||
| Political Freedoms: | Superb | ||
| Income Tax Rate: | 71% | ||
| Consumer Confidence Rate: | 95% | ||
| Worker Enthusiasm Rate: | 97% | ||
| Major Industry: | Pizza Delivery | ||
| National Animal: | leopard | ||
| Zulankan Outpost 11 Demographics | |||
| Total Population: | 21,804,000,000 | ||
| Criminals: | 2,505,139,398 | ||
| Elderly, Disabled, & Retirees: | 2,388,872,421 | ||
| Military & Reserves: ? | 433,863,097 | ||
| Students and Youth: | 4,340,086,200 | ||
| Unemployed but Able: | 3,531,087,457 | ||
| Working Class: | 8,604,951,427 | ||
| Zulankan Outpost 11 Government Budget Details | |||
| Government Budget: | $5,731,429,313,384.28 | ||
| Government Expenditures: | $5,616,800,727,116.60 | ||
| Goverment Waste: | $114,628,586,267.69 | ||
| Goverment Efficiency: | 98% | ||
| Zulankan Outpost 11 Government Spending Breakdown: | |||
| Administration: | $449,344,058,169.33 | 8% | |
| Social Welfare: | $1,123,360,145,423.32 | 20% | |
| Healthcare: | $561,680,072,711.66 | 10% | |
| Education: | $617,848,079,982.83 | 11% | |
| Religion & Spirituality: | $337,008,043,627.00 | 6% | |
| Defense: | $449,344,058,169.33 | 8% | |
| Law & Order: | $337,008,043,627.00 | 6% | |
| Commerce: | $337,008,043,627.00 | 6% | |
| Public Transport: | $449,344,058,169.33 | 8% | |
| The Environment: | $337,008,043,627.00 | 6% | |
| Social Equality: | $449,344,058,169.33 | 8% | |
| Zulankan Outpost 11White Market Economic Statistics ? | |||
| Gross Domestic Product: | $4,615,330,000,000.00 | ||
| GDP Per Capita: | $211.67 | ||
| Average Salary Per Employee: | $321.26 | ||
| Unemployment Rate: | 25.97% | ||
| Consumption: | $2,045,264,039,772.16 | ||
| Exports: | $1,008,228,827,136.00 | ||
| Imports: | $1,008,228,827,136.00 | ||
| Trade Net: | 0.00 | ||
| Zulankan Outpost 11 Non Market Statistics ? Evasion, Black Market, Barter & Crime | |||
| Black & Grey Markets Combined: | $15,654,744,179,780.29 | ||
| Avg Annual Criminal's Income / Savings: ? | $448.93 | ||
| Recovered Product + Fines & Fees: | $704,463,488,090.11 | ||
| Black Market & Non Monetary Trade: | |||
| Guns & Weapons: | $404,778,849,727.51 | ||
| Drugs and Pharmaceuticals: | $788,253,549,469.37 | ||
| Extortion & Blackmail: | $596,516,199,598.44 | ||
| Counterfeit Goods: | $681,732,799,541.07 | ||
| Trafficking & Intl Sales: | $596,516,199,598.44 | ||
| Theft & Disappearance: | $766,949,399,483.71 | ||
| Counterfeit Currency & Instruments : | $766,949,399,483.71 | ||
| Illegal Mining, Logging, and Hunting : | $426,082,999,713.17 | ||
| Basic Necessitites : | $1,256,944,849,153.85 | ||
| School Loan Fraud : | $596,516,199,598.44 | ||
| Tax Evasion + Barter Trade : | $6,731,539,997,305.53 | ||
| Zulankan Outpost 11 Total Market Statistics ? | |||
| National Currency: | labor certificate | ||
| Exchange Rates: | 1 labor certificate = $0.01 | ||
| $1 = 73.85 labor certificates | |||
| Regional Exchange Rates | |||
| Gross Domestic Product: | $4,615,330,000,000.00 - 23% | ||
| Black & Grey Markets Combined: | $15,654,744,179,780.29 - 77% | ||
| Real Total Economy: | $20,270,074,179,780.30 | ||
| Reichskommissariat Westindien Economic Statistics & Links | |||
| Gross Regional Product: | $7,052,634,619,904 | ||
| Region Wide Imports: | $1,008,228,827,136 | ||
| Largest Regional GDP: | Zulankan Outpost 11 | ||
| Largest Regional Importer: | Zulankan Outpost 11 | ||
| Regional Search Functions: | All Reichskommissariat Westindien Nations. | ||
| Regional Nations by GDP | Regional Trading Leaders | |||
| Regional Exchange Rates | WA Members | |||
| Returns to standard Version: | FAQ | About | About | 590,776,405 uses since September 1, 2011. | |
Version 3.69 HTML4. V 0.7 is HTML1. |
Like our Calculator? Tell your friends for us... |