The Free Land of Why do you hate the global poor
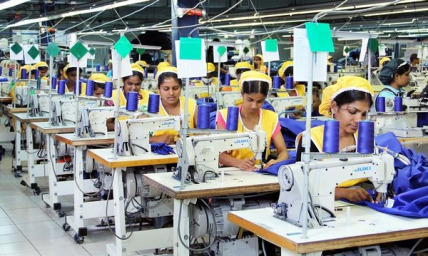
This is better than subsistence farming
Region: Neoliberal globalism
Quicksearch Query: Why do you hate the global poor
|
Quicksearch: | |
NS Economy Mobile Home |
Regions Search |
Why do you hate the global poor NS Page |
|
| GDP Leaders | Export Leaders | Interesting Places BIG Populations | Most Worked | | Militaristic States | Police States | |

This is better than subsistence farming
Region: Neoliberal globalism
Quicksearch Query: Why do you hate the global poor
| Why do you hate the global poor Domestic Statistics | |||
|---|---|---|---|
| Government Category: | Free Land | ||
| Government Priority: | Defence | ||
| Economic Rating: | Frightening | ||
| Civil Rights Rating: | Rare | ||
| Political Freedoms: | Very Good | ||
| Income Tax Rate: | 23% | ||
| Consumer Confidence Rate: | 98% | ||
| Worker Enthusiasm Rate: | 101% | ||
| Major Industry: | Arms Manufacturing | ||
| National Animal: | Clinton | ||
| Why do you hate the global poor Demographics | |||
| Total Population: | 494,000,000 | ||
| Criminals: | 42,324,410 | ||
| Elderly, Disabled, & Retirees: | 66,869,914 | ||
| Military & Reserves: ? | 35,948,728 | ||
| Students and Youth: | 85,289,100 | ||
| Unemployed but Able: | 69,076,009 | ||
| Working Class: | 194,491,839 | ||
| Why do you hate the global poor Government Budget Details | |||
| Government Budget: | $5,869,838,157,742.08 | ||
| Government Expenditures: | $5,693,743,013,009.82 | ||
| Goverment Waste: | $176,095,144,732.26 | ||
| Goverment Efficiency: | 97% | ||
| Why do you hate the global poor Government Spending Breakdown: | |||
| Administration: | $797,124,021,821.38 | 14% | |
| Social Welfare: | $0.00 | 0% | |
| Healthcare: | $284,687,150,650.49 | 5% | |
| Education: | $626,311,731,431.08 | 11% | |
| Religion & Spirituality: | $0.00 | 0% | |
| Defense: | $1,480,373,183,382.55 | 26% | |
| Law & Order: | $854,061,451,951.47 | 15% | |
| Commerce: | $967,936,312,211.67 | 17% | |
| Public Transport: | $227,749,720,520.39 | 4% | |
| The Environment: | $170,812,290,390.30 | 3% | |
| Social Equality: | $227,749,720,520.39 | 4% | |
| Why do you hate the global poorWhite Market Economic Statistics ? | |||
| Gross Domestic Product: | $4,868,150,000,000.00 | ||
| GDP Per Capita: | $9,854.55 | ||
| Average Salary Per Employee: | $16,103.61 | ||
| Unemployment Rate: | 16.70% | ||
| Consumption: | $13,190,551,306,240.00 | ||
| Exports: | $2,371,178,831,872.00 | ||
| Imports: | $2,408,762,310,656.00 | ||
| Trade Net: | -37,583,478,784.00 | ||
| Why do you hate the global poor Non Market Statistics ? Evasion, Black Market, Barter & Crime | |||
| Black & Grey Markets Combined: | $12,155,930,702,786.32 | ||
| Avg Annual Criminal's Income / Savings: ? | $26,892.18 | ||
| Recovered Product + Fines & Fees: | $1,367,542,204,063.46 | ||
| Black Market & Non Monetary Trade: | |||
| Guns & Weapons: | $799,419,587,755.36 | ||
| Drugs and Pharmaceuticals: | $322,842,525,824.28 | ||
| Extortion & Blackmail: | $953,154,123,862.16 | ||
| Counterfeit Goods: | $1,383,610,824,961.21 | ||
| Trafficking & Intl Sales: | $169,107,989,717.48 | ||
| Theft & Disappearance: | $276,722,164,992.24 | ||
| Counterfeit Currency & Instruments : | $1,291,370,103,297.13 | ||
| Illegal Mining, Logging, and Hunting : | $153,734,536,106.80 | ||
| Basic Necessitites : | $230,601,804,160.20 | ||
| School Loan Fraud : | $384,336,340,267.00 | ||
| Tax Evasion + Barter Trade : | $5,227,050,202,198.12 | ||
| Why do you hate the global poor Total Market Statistics ? | |||
| National Currency: | Globe | ||
| Exchange Rates: | 1 Globe = $0.92 | ||
| $1 = 1.08 Globes | |||
| Regional Exchange Rates | |||
| Gross Domestic Product: | $4,868,150,000,000.00 - 29% | ||
| Black & Grey Markets Combined: | $12,155,930,702,786.32 - 71% | ||
| Real Total Economy: | $17,024,080,702,786.32 | ||
| Neoliberal globalism Economic Statistics & Links | |||
| Gross Regional Product: | $176,052,756,283,392 | ||
| Region Wide Imports: | $24,368,843,325,440 | ||
| Largest Regional GDP: | ECOWAS | ||
| Largest Regional Importer: | ECOWAS | ||
| Regional Search Functions: | All Neoliberal globalism Nations. | ||
| Regional Nations by GDP | Regional Trading Leaders | |||
| Regional Exchange Rates | WA Members | |||
| Returns to standard Version: | FAQ | About | About | 569,237,215 uses since September 1, 2011. | |
Version 3.69 HTML4. V 0.7 is HTML1. |
Like our Calculator? Tell your friends for us... |