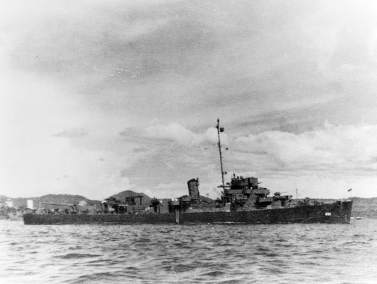
The Dictatorship of USS James E Craig
Hummanty is at risk we must FIGHT
Region: The Docks
Quicksearch Query: USS James E Craig
|
Quicksearch: | |
NS Economy Mobile Home |
Regions Search |
USS James E Craig NS Page |
|
| GDP Leaders | Export Leaders | Interesting Places BIG Populations | Most Worked | | Militaristic States | Police States | |

Hummanty is at risk we must FIGHT
Region: The Docks
Quicksearch Query: USS James E Craig
| USS James E Craig Domestic Statistics | |||
|---|---|---|---|
| Government Category: | Dictatorship | ||
| Government Priority: | Defence | ||
| Economic Rating: | Good | ||
| Civil Rights Rating: | Good | ||
| Political Freedoms: | Good | ||
| Income Tax Rate: | 16% | ||
| Consumer Confidence Rate: | 101% | ||
| Worker Enthusiasm Rate: | 103% | ||
| Major Industry: | Trout Farming | ||
| National Animal: | Kitsune | ||
| USS James E Craig Demographics | |||
| Total Population: | 1,759,000,000 | ||
| Criminals: | 196,411,359 | ||
| Elderly, Disabled, & Retirees: | 243,416,034 | ||
| Military & Reserves: ? | 67,132,974 | ||
| Students and Youth: | 295,512,000 | ||
| Unemployed but Able: | 277,738,679 | ||
| Working Class: | 678,788,955 | ||
| USS James E Craig Government Budget Details | |||
| Government Budget: | $3,780,186,897,414.88 | ||
| Government Expenditures: | $3,628,979,421,518.29 | ||
| Goverment Waste: | $151,207,475,896.60 | ||
| Goverment Efficiency: | 96% | ||
| USS James E Craig Government Spending Breakdown: | |||
| Administration: | $362,897,942,151.83 | 10% | |
| Social Welfare: | $399,187,736,367.01 | 11% | |
| Healthcare: | $399,187,736,367.01 | 11% | |
| Education: | $362,897,942,151.83 | 10% | |
| Religion & Spirituality: | $108,869,382,645.55 | 3% | |
| Defense: | $544,346,913,227.74 | 15% | |
| Law & Order: | $544,346,913,227.74 | 15% | |
| Commerce: | $145,159,176,860.73 | 4% | |
| Public Transport: | $362,897,942,151.83 | 10% | |
| The Environment: | $145,159,176,860.73 | 4% | |
| Social Equality: | $181,448,971,075.91 | 5% | |
| USS James E CraigWhite Market Economic Statistics ? | |||
| Gross Domestic Product: | $3,185,040,000,000.00 | ||
| GDP Per Capita: | $1,810.71 | ||
| Average Salary Per Employee: | $3,172.87 | ||
| Unemployment Rate: | 24.27% | ||
| Consumption: | $11,535,007,969,443.84 | ||
| Exports: | $1,872,246,088,704.00 | ||
| Imports: | $1,876,754,563,072.00 | ||
| Trade Net: | -4,508,474,368.00 | ||
| USS James E Craig Non Market Statistics ? Evasion, Black Market, Barter & Crime | |||
| Black & Grey Markets Combined: | $3,470,839,955,118.15 | ||
| Avg Annual Criminal's Income / Savings: ? | $1,472.61 | ||
| Recovered Product + Fines & Fees: | $390,469,494,950.79 | ||
| Black Market & Non Monetary Trade: | |||
| Guns & Weapons: | $138,270,129,030.76 | ||
| Drugs and Pharmaceuticals: | $153,633,476,700.85 | ||
| Extortion & Blackmail: | $122,906,781,360.68 | ||
| Counterfeit Goods: | $232,644,979,004.14 | ||
| Trafficking & Intl Sales: | $118,517,253,454.94 | ||
| Theft & Disappearance: | $140,464,892,983.63 | ||
| Counterfeit Currency & Instruments : | $285,319,313,873.00 | ||
| Illegal Mining, Logging, and Hunting : | $79,011,502,303.29 | ||
| Basic Necessitites : | $162,412,532,512.32 | ||
| School Loan Fraud : | $105,348,669,737.72 | ||
| Tax Evasion + Barter Trade : | $1,492,461,180,700.80 | ||
| USS James E Craig Total Market Statistics ? | |||
| National Currency: | Delta Eagle | ||
| Exchange Rates: | 1 Delta Eagle = $0.18 | ||
| $1 = 5.45 Delta Eagles | |||
| Regional Exchange Rates | |||
| Gross Domestic Product: | $3,185,040,000,000.00 - 48% | ||
| Black & Grey Markets Combined: | $3,470,839,955,118.15 - 52% | ||
| Real Total Economy: | $6,655,879,955,118.15 | ||
| The Docks Economic Statistics & Links | |||
| Gross Regional Product: | $4,448,714,508,730,368 | ||
| Region Wide Imports: | $606,539,173,855,232 | ||
| Largest Regional GDP: | USS Herring | ||
| Largest Regional Importer: | USS Herring | ||
| Regional Search Functions: | All The Docks Nations. | ||
| Regional Nations by GDP | Regional Trading Leaders | |||
| Regional Exchange Rates | WA Members | |||
| Returns to standard Version: | FAQ | About | About | 594,359,044 uses since September 1, 2011. | |
Version 3.69 HTML4. V 0.7 is HTML1. |
Like our Calculator? Tell your friends for us... |