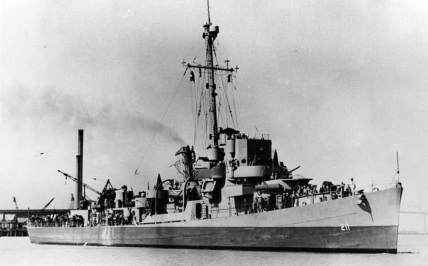
The Constitutional Monarchy of USS Hubbard
Hummanty is at risk we must FIGHT
Region: The Docks
Quicksearch Query: USS Hubbard
|
Quicksearch: | |
NS Economy Mobile Home |
Regions Search |
USS Hubbard NS Page |
|
| GDP Leaders | Export Leaders | Interesting Places BIG Populations | Most Worked | | Militaristic States | Police States | |
Hummanty is at risk we must FIGHT
Region: The Docks
Quicksearch Query: USS Hubbard
| USS Hubbard Domestic Statistics | |||
|---|---|---|---|
| Government Category: | Constitutional Monarchy | ||
| Government Priority: | Defence | ||
| Economic Rating: | Good | ||
| Civil Rights Rating: | Good | ||
| Political Freedoms: | Good | ||
| Income Tax Rate: | 20% | ||
| Consumer Confidence Rate: | 101% | ||
| Worker Enthusiasm Rate: | 103% | ||
| Major Industry: | Uranium Mining | ||
| National Animal: | Kitsune | ||
| USS Hubbard Demographics | |||
| Total Population: | 2,591,000,000 | ||
| Criminals: | 287,272,981 | ||
| Elderly, Disabled, & Retirees: | 353,428,899 | ||
| Military & Reserves: ? | 99,197,017 | ||
| Students and Youth: | 440,470,000 | ||
| Unemployed but Able: | 407,639,047 | ||
| Working Class: | 1,002,992,056 | ||
| USS Hubbard Government Budget Details | |||
| Government Budget: | $6,346,163,657,637.89 | ||
| Government Expenditures: | $6,092,317,111,332.37 | ||
| Goverment Waste: | $253,846,546,305.52 | ||
| Goverment Efficiency: | 96% | ||
| USS Hubbard Government Spending Breakdown: | |||
| Administration: | $609,231,711,133.24 | 10% | |
| Social Welfare: | $670,154,882,246.56 | 11% | |
| Healthcare: | $670,154,882,246.56 | 11% | |
| Education: | $609,231,711,133.24 | 10% | |
| Religion & Spirituality: | $182,769,513,339.97 | 3% | |
| Defense: | $913,847,566,699.86 | 15% | |
| Law & Order: | $913,847,566,699.86 | 15% | |
| Commerce: | $243,692,684,453.30 | 4% | |
| Public Transport: | $609,231,711,133.24 | 10% | |
| The Environment: | $243,692,684,453.30 | 4% | |
| Social Equality: | $304,615,855,566.62 | 5% | |
| USS HubbardWhite Market Economic Statistics ? | |||
| Gross Domestic Product: | $5,284,120,000,000.00 | ||
| GDP Per Capita: | $2,039.41 | ||
| Average Salary Per Employee: | $3,562.44 | ||
| Unemployment Rate: | 24.04% | ||
| Consumption: | $16,185,064,161,280.00 | ||
| Exports: | $2,758,205,621,312.00 | ||
| Imports: | $2,757,148,016,640.00 | ||
| Trade Net: | 1,057,604,672.00 | ||
| USS Hubbard Non Market Statistics ? Evasion, Black Market, Barter & Crime | |||
| Black & Grey Markets Combined: | $6,385,752,324,576.38 | ||
| Avg Annual Criminal's Income / Savings: ? | $1,852.41 | ||
| Recovered Product + Fines & Fees: | $718,397,136,514.84 | ||
| Black Market & Non Monetary Trade: | |||
| Guns & Weapons: | $254,393,406,004.11 | ||
| Drugs and Pharmaceuticals: | $282,659,340,004.57 | ||
| Extortion & Blackmail: | $226,127,472,003.66 | ||
| Counterfeit Goods: | $428,027,000,578.35 | ||
| Trafficking & Intl Sales: | $218,051,490,860.67 | ||
| Theft & Disappearance: | $258,431,396,575.61 | ||
| Counterfeit Currency & Instruments : | $524,938,774,294.20 | ||
| Illegal Mining, Logging, and Hunting : | $145,367,660,573.78 | ||
| Basic Necessitites : | $298,811,302,290.54 | ||
| School Loan Fraud : | $193,823,547,431.71 | ||
| Tax Evasion + Barter Trade : | $2,745,873,499,567.84 | ||
| USS Hubbard Total Market Statistics ? | |||
| National Currency: | Delta Eagle | ||
| Exchange Rates: | 1 Delta Eagle = $0.19 | ||
| $1 = 5.14 Delta Eagles | |||
| Regional Exchange Rates | |||
| Gross Domestic Product: | $5,284,120,000,000.00 - 45% | ||
| Black & Grey Markets Combined: | $6,385,752,324,576.38 - 55% | ||
| Real Total Economy: | $11,669,872,324,576.38 | ||
| The Docks Economic Statistics & Links | |||
| Gross Regional Product: | $7,158,641,035,575,296 | ||
| Region Wide Imports: | $975,961,726,124,032 | ||
| Largest Regional GDP: | USS Herring | ||
| Largest Regional Importer: | USS Herring | ||
| Regional Search Functions: | All The Docks Nations. | ||
| Regional Nations by GDP | Regional Trading Leaders | |||
| Regional Exchange Rates | WA Members | |||
| Returns to standard Version: | FAQ | About | About | 632,819,105 uses since September 1, 2011. | |
Version 3.69 HTML4. V 0.7 is HTML1. |
Like our Calculator? Tell your friends for us... |