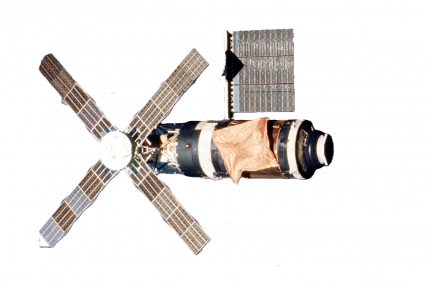
The Community of The Skylab
Providing the human touch to space technology!
Region: The Moon
Quicksearch Query: The Skylab
|
Quicksearch: | |
NS Economy Mobile Home |
Regions Search |
The Skylab NS Page |
|
| GDP Leaders | Export Leaders | Interesting Places BIG Populations | Most Worked | | Militaristic States | Police States | |

Providing the human touch to space technology!
Region: The Moon
Quicksearch Query: The Skylab
| The Skylab Domestic Statistics | |||
|---|---|---|---|
| Government Category: | Community | ||
| Government Priority: | Social Welfare | ||
| Economic Rating: | Strong | ||
| Civil Rights Rating: | Good | ||
| Political Freedoms: | Very Good | ||
| Income Tax Rate: | 20% | ||
| Consumer Confidence Rate: | 102% | ||
| Worker Enthusiasm Rate: | 104% | ||
| Major Industry: | Woodchip Exports | ||
| National Animal: | Space Barnacle | ||
| The Skylab Demographics | |||
| Total Population: | 5,569,000,000 | ||
| Criminals: | 597,295,785 | ||
| Elderly, Disabled, & Retirees: | 727,296,096 | ||
| Military & Reserves: ? | 129,198,507 | ||
| Students and Youth: | 985,713,000 | ||
| Unemployed but Able: | 866,130,183 | ||
| Working Class: | 2,263,366,430 | ||
| The Skylab Government Budget Details | |||
| Government Budget: | $18,810,063,046,007.85 | ||
| Government Expenditures: | $18,245,761,154,627.62 | ||
| Goverment Waste: | $564,301,891,380.23 | ||
| Goverment Efficiency: | 97% | ||
| The Skylab Government Spending Breakdown: | |||
| Administration: | $1,277,203,280,823.93 | 7% | |
| Social Welfare: | $3,101,779,396,286.70 | 17% | |
| Healthcare: | $1,459,660,892,370.21 | 8% | |
| Education: | $3,101,779,396,286.70 | 17% | |
| Religion & Spirituality: | $1,277,203,280,823.93 | 7% | |
| Defense: | $1,642,118,503,916.49 | 9% | |
| Law & Order: | $2,371,948,950,101.59 | 13% | |
| Commerce: | $547,372,834,638.83 | 3% | |
| Public Transport: | $1,094,745,669,277.66 | 6% | |
| The Environment: | $729,830,446,185.11 | 4% | |
| Social Equality: | $1,094,745,669,277.66 | 6% | |
| The SkylabWhite Market Economic Statistics ? | |||
| Gross Domestic Product: | $15,452,800,000,000.00 | ||
| GDP Per Capita: | $2,774.79 | ||
| Average Salary Per Employee: | $4,707.60 | ||
| Unemployment Rate: | 23.28% | ||
| Consumption: | $47,297,116,032,204.80 | ||
| Exports: | $7,604,224,458,752.00 | ||
| Imports: | $8,032,351,682,560.00 | ||
| Trade Net: | -428,127,223,808.00 | ||
| The Skylab Non Market Statistics ? Evasion, Black Market, Barter & Crime | |||
| Black & Grey Markets Combined: | $18,430,233,371,648.12 | ||
| Avg Annual Criminal's Income / Savings: ? | $2,380.87 | ||
| Recovered Product + Fines & Fees: | $1,796,947,753,735.69 | ||
| Black Market & Non Monetary Trade: | |||
| Guns & Weapons: | $509,602,288,118.79 | ||
| Drugs and Pharmaceuticals: | $948,097,280,221.01 | ||
| Extortion & Blackmail: | $474,048,640,110.50 | ||
| Counterfeit Goods: | $971,799,712,226.53 | ||
| Trafficking & Intl Sales: | $545,155,936,127.08 | ||
| Theft & Disappearance: | $663,668,096,154.71 | ||
| Counterfeit Currency & Instruments : | $1,161,419,168,270.74 | ||
| Illegal Mining, Logging, and Hunting : | $331,834,048,077.35 | ||
| Basic Necessitites : | $1,351,038,624,314.94 | ||
| School Loan Fraud : | $900,692,416,209.96 | ||
| Tax Evasion + Barter Trade : | $7,925,000,349,808.69 | ||
| The Skylab Total Market Statistics ? | |||
| National Currency: | Ration | ||
| Exchange Rates: | 1 Ration = $0.26 | ||
| $1 = 3.82 Rations | |||
| Regional Exchange Rates | |||
| Gross Domestic Product: | $15,452,800,000,000.00 - 46% | ||
| Black & Grey Markets Combined: | $18,430,233,371,648.12 - 54% | ||
| Real Total Economy: | $33,883,033,371,648.12 | ||
| The Moon Economic Statistics & Links | |||
| Gross Regional Product: | $9,136,620,578,013,184 | ||
| Region Wide Imports: | $1,175,156,873,494,528 | ||
| Largest Regional GDP: | Moonlight Shadow | ||
| Largest Regional Importer: | Moonlight Shadow | ||
| Regional Search Functions: | All The Moon Nations. | ||
| Regional Nations by GDP | Regional Trading Leaders | |||
| Regional Exchange Rates | WA Members | |||
| Returns to standard Version: | FAQ | About | About | 588,984,966 uses since September 1, 2011. | |
Version 3.69 HTML4. V 0.7 is HTML1. |
Like our Calculator? Tell your friends for us... |