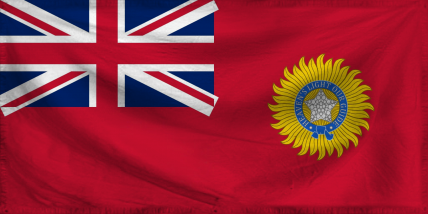
The British Crown Colony of The Indian-British Raj
Heaven's Light Our Guide!
Region: The Astral Express
Quicksearch Query: The Indian-British Raj
|
Quicksearch: | |
NS Economy Mobile Home |
Regions Search |
The Indian-British Raj NS Page |
|
| GDP Leaders | Export Leaders | Interesting Places BIG Populations | Most Worked | | Militaristic States | Police States | |
Heaven's Light Our Guide!
Region: The Astral Express
Quicksearch Query: The Indian-British Raj
| The Indian-British Raj Domestic Statistics | |||
|---|---|---|---|
| Government Category: | British Crown Colony | ||
| Government Priority: | Defence | ||
| Economic Rating: | Very Strong | ||
| Civil Rights Rating: | Excellent | ||
| Political Freedoms: | Excellent | ||
| Income Tax Rate: | 5% | ||
| Consumer Confidence Rate: | 104% | ||
| Worker Enthusiasm Rate: | 107% | ||
| Major Industry: | Automobile Manufacturing | ||
| National Animal: | Lion | ||
| The Indian-British Raj Demographics | |||
| Total Population: | 4,556,000,000 | ||
| Criminals: | 488,188,570 | ||
| Elderly, Disabled, & Retirees: | 661,451,571 | ||
| Military & Reserves: ? | 339,220,875 | ||
| Students and Youth: | 744,906,000 | ||
| Unemployed but Able: | 711,908,599 | ||
| Working Class: | 1,610,324,385 | ||
| The Indian-British Raj Government Budget Details | |||
| Government Budget: | $13,473,413,277,375.53 | ||
| Government Expenditures: | $13,203,945,011,828.02 | ||
| Goverment Waste: | $269,468,265,547.51 | ||
| Goverment Efficiency: | 98% | ||
| The Indian-British Raj Government Spending Breakdown: | |||
| Administration: | $2,376,710,102,129.04 | 18% | |
| Social Welfare: | $0.00 | 0% | |
| Healthcare: | $1,848,552,301,655.92 | 14% | |
| Education: | $1,848,552,301,655.92 | 14% | |
| Religion & Spirituality: | $0.00 | 0% | |
| Defense: | $3,829,144,053,430.13 | 29% | |
| Law & Order: | $0.00 | 0% | |
| Commerce: | $528,157,800,473.12 | 4% | |
| Public Transport: | $1,848,552,301,655.92 | 14% | |
| The Environment: | $0.00 | 0% | |
| Social Equality: | $924,276,150,827.96 | 7% | |
| The Indian-British RajWhite Market Economic Statistics ? | |||
| Gross Domestic Product: | $11,276,700,000,000.00 | ||
| GDP Per Capita: | $2,475.13 | ||
| Average Salary Per Employee: | $5,065.23 | ||
| Unemployment Rate: | 23.59% | ||
| Consumption: | $72,259,816,600,371.20 | ||
| Exports: | $9,105,518,755,840.00 | ||
| Imports: | $10,272,130,465,792.00 | ||
| Trade Net: | -1,166,611,709,952.00 | ||
| The Indian-British Raj Non Market Statistics ? Evasion, Black Market, Barter & Crime | |||
| Black & Grey Markets Combined: | $5,894,398,777,639.24 | ||
| Avg Annual Criminal's Income / Savings: ? | $996.21 | ||
| Recovered Product + Fines & Fees: | $0.00 | ||
| Black Market & Non Monetary Trade: | |||
| Guns & Weapons: | $487,172,058,971.88 | ||
| Drugs and Pharmaceuticals: | $352,779,766,841.71 | ||
| Extortion & Blackmail: | $369,578,803,357.98 | ||
| Counterfeit Goods: | $310,782,175,551.03 | ||
| Trafficking & Intl Sales: | $235,186,511,227.81 | ||
| Theft & Disappearance: | $352,779,766,841.71 | ||
| Counterfeit Currency & Instruments : | $545,968,686,778.84 | ||
| Illegal Mining, Logging, and Hunting : | $117,593,255,613.90 | ||
| Basic Necessitites : | $176,389,883,420.85 | ||
| School Loan Fraud : | $235,186,511,227.81 | ||
| Tax Evasion + Barter Trade : | $2,534,591,474,384.88 | ||
| The Indian-British Raj Total Market Statistics ? | |||
| National Currency: | Indian Rupee | ||
| Exchange Rates: | 1 Indian Rupee = $0.30 | ||
| $1 = 3.30 Indian Rupees | |||
| Regional Exchange Rates | |||
| Gross Domestic Product: | $11,276,700,000,000.00 - 66% | ||
| Black & Grey Markets Combined: | $5,894,398,777,639.24 - 34% | ||
| Real Total Economy: | $17,171,098,777,639.24 | ||
| The Astral Express Economic Statistics & Links | |||
| Gross Regional Product: | $2,472,051,642,204,160 | ||
| Region Wide Imports: | $295,929,991,135,232 | ||
| Largest Regional GDP: | North Goguryeo | ||
| Largest Regional Importer: | North Goguryeo | ||
| Regional Search Functions: | All The Astral Express Nations. | ||
| Regional Nations by GDP | Regional Trading Leaders | |||
| Regional Exchange Rates | WA Members | |||
| Returns to standard Version: | FAQ | About | About | 640,454,026 uses since September 1, 2011. | |
Version 3.69 HTML4. V 0.7 is HTML1. |
Like our Calculator? Tell your friends for us... |