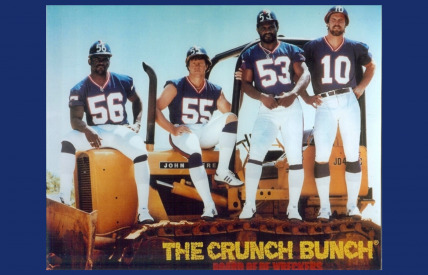
The Legendary Giants Linebackers of The Crunch Bunch
Celebrating the NFL
Region: New York Giants
Quicksearch Query: The Crunch Bunch
|
Quicksearch: | |
NS Economy Mobile Home |
Regions Search |
The Crunch Bunch NS Page |
|
| GDP Leaders | Export Leaders | Interesting Places BIG Populations | Most Worked | | Militaristic States | Police States | |

Celebrating the NFL
Region: New York Giants
Quicksearch Query: The Crunch Bunch
| The Crunch Bunch Domestic Statistics | |||
|---|---|---|---|
| Government Category: | Legendary Giants Linebackers | ||
| Government Priority: | Defence | ||
| Economic Rating: | Good | ||
| Civil Rights Rating: | Few | ||
| Political Freedoms: | Few | ||
| Income Tax Rate: | 60% | ||
| Consumer Confidence Rate: | 96% | ||
| Worker Enthusiasm Rate: | 97% | ||
| Major Industry: | Arms Manufacturing | ||
| National Animal: | elephant | ||
| The Crunch Bunch Demographics | |||
| Total Population: | 5,135,000,000 | ||
| Criminals: | 568,794,135 | ||
| Elderly, Disabled, & Retirees: | 574,760,438 | ||
| Military & Reserves: ? | 253,691,607 | ||
| Students and Youth: | 975,650,000 | ||
| Unemployed but Able: | 790,430,453 | ||
| Working Class: | 1,971,673,367 | ||
| The Crunch Bunch Government Budget Details | |||
| Government Budget: | $23,822,590,952,823.85 | ||
| Government Expenditures: | $21,916,783,676,597.94 | ||
| Goverment Waste: | $1,905,807,276,225.91 | ||
| Goverment Efficiency: | 92% | ||
| The Crunch Bunch Government Spending Breakdown: | |||
| Administration: | $438,335,673,531.96 | 2% | |
| Social Welfare: | $1,972,510,530,893.81 | 9% | |
| Healthcare: | $2,849,181,877,957.73 | 13% | |
| Education: | $2,191,678,367,659.79 | 10% | |
| Religion & Spirituality: | $876,671,347,063.92 | 4% | |
| Defense: | $4,164,188,898,553.61 | 19% | |
| Law & Order: | $3,506,685,388,255.67 | 16% | |
| Commerce: | $1,315,007,020,595.88 | 6% | |
| Public Transport: | $1,315,007,020,595.88 | 6% | |
| The Environment: | $1,972,510,530,893.81 | 9% | |
| Social Equality: | $1,095,839,183,829.90 | 5% | |
| The Crunch BunchWhite Market Economic Statistics ? | |||
| Gross Domestic Product: | $17,653,600,000,000.00 | ||
| GDP Per Capita: | $3,437.90 | ||
| Average Salary Per Employee: | $5,419.44 | ||
| Unemployment Rate: | 22.61% | ||
| Consumption: | $14,380,629,281,996.80 | ||
| Exports: | $4,777,513,295,872.00 | ||
| Imports: | $4,726,463,135,744.00 | ||
| Trade Net: | 51,050,160,128.00 | ||
| The Crunch Bunch Non Market Statistics ? Evasion, Black Market, Barter & Crime | |||
| Black & Grey Markets Combined: | $70,024,577,559,368.64 | ||
| Avg Annual Criminal's Income / Savings: ? | $10,799.17 | ||
| Recovered Product + Fines & Fees: | $8,402,949,307,124.24 | ||
| Black Market & Non Monetary Trade: | |||
| Guns & Weapons: | $3,512,432,810,377.93 | ||
| Drugs and Pharmaceuticals: | $3,512,432,810,377.93 | ||
| Extortion & Blackmail: | $1,404,973,124,151.17 | ||
| Counterfeit Goods: | $5,532,081,676,345.24 | ||
| Trafficking & Intl Sales: | $2,195,270,506,486.21 | ||
| Theft & Disappearance: | $3,161,189,529,340.14 | ||
| Counterfeit Currency & Instruments : | $4,829,595,114,269.66 | ||
| Illegal Mining, Logging, and Hunting : | $2,107,459,686,226.76 | ||
| Basic Necessitites : | $2,897,757,068,561.79 | ||
| School Loan Fraud : | $2,546,513,787,524.00 | ||
| Tax Evasion + Barter Trade : | $30,110,568,350,528.52 | ||
| The Crunch Bunch Total Market Statistics ? | |||
| National Currency: | rupee | ||
| Exchange Rates: | 1 rupee = $0.25 | ||
| $1 = 3.96 rupees | |||
| Regional Exchange Rates | |||
| Gross Domestic Product: | $17,653,600,000,000.00 - 20% | ||
| Black & Grey Markets Combined: | $70,024,577,559,368.64 - 80% | ||
| Real Total Economy: | $87,678,177,559,368.64 | ||
| New York Giants Economic Statistics & Links | |||
| Gross Regional Product: | $1,363,486,491,803,648 | ||
| Region Wide Imports: | $181,190,258,589,696 | ||
| Largest Regional GDP: | Darren Waller | ||
| Largest Regional Importer: | Drew Lock | ||
| Regional Search Functions: | All New York Giants Nations. | ||
| Regional Nations by GDP | Regional Trading Leaders | |||
| Regional Exchange Rates | WA Members | |||
| Returns to standard Version: | FAQ | About | About | 579,382,867 uses since September 1, 2011. | |
Version 3.69 HTML4. V 0.7 is HTML1. |
Like our Calculator? Tell your friends for us... |