The Colony of Tampere sub-region
By The People For The People
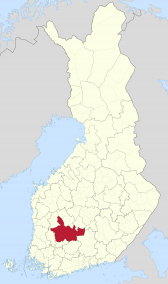
Region: Sub regions of Finland
Quicksearch Query: Tampere sub-region
|
Quicksearch: | |
NS Economy Mobile Home |
Regions Search |
Tampere sub-region NS Page |
|
| GDP Leaders | Export Leaders | Interesting Places BIG Populations | Most Worked | | Militaristic States | Police States | |
By The People For The People
Region: Sub regions of Finland
Quicksearch Query: Tampere sub-region
| Tampere sub-region Domestic Statistics | |||
|---|---|---|---|
| Government Category: | Colony | ||
| Government Priority: | Defence | ||
| Economic Rating: | Frightening | ||
| Civil Rights Rating: | Rare | ||
| Political Freedoms: | Few | ||
| Income Tax Rate: | 36% | ||
| Consumer Confidence Rate: | 98% | ||
| Worker Enthusiasm Rate: | 99% | ||
| Major Industry: | Arms Manufacturing | ||
| National Animal: | kangaroo | ||
| Tampere sub-region Demographics | |||
| Total Population: | 4,737,000,000 | ||
| Criminals: | 409,170,028 | ||
| Elderly, Disabled, & Retirees: | 578,076,262 | ||
| Military & Reserves: ? | 228,487,108 | ||
| Students and Youth: | 860,239,200 | ||
| Unemployed but Able: | 649,444,819 | ||
| Working Class: | 2,011,582,582 | ||
| Tampere sub-region Government Budget Details | |||
| Government Budget: | $71,541,248,889,727.22 | ||
| Government Expenditures: | $65,817,948,978,549.05 | ||
| Goverment Waste: | $5,723,299,911,178.17 | ||
| Goverment Efficiency: | 92% | ||
| Tampere sub-region Government Spending Breakdown: | |||
| Administration: | $9,214,512,856,996.87 | 14% | |
| Social Welfare: | $3,290,897,448,927.45 | 5% | |
| Healthcare: | $5,923,615,408,069.41 | 9% | |
| Education: | $7,898,153,877,425.89 | 12% | |
| Religion & Spirituality: | $0.00 | 0% | |
| Defense: | $11,189,051,326,353.34 | 17% | |
| Law & Order: | $11,189,051,326,353.34 | 17% | |
| Commerce: | $9,872,692,346,782.36 | 15% | |
| Public Transport: | $1,316,358,979,570.98 | 2% | |
| The Environment: | $3,949,076,938,712.94 | 6% | |
| Social Equality: | $2,632,717,959,141.96 | 4% | |
| Tampere sub-regionWhite Market Economic Statistics ? | |||
| Gross Domestic Product: | $53,262,100,000,000.00 | ||
| GDP Per Capita: | $11,243.85 | ||
| Average Salary Per Employee: | $16,697.64 | ||
| Unemployment Rate: | 15.56% | ||
| Consumption: | $103,092,336,229,089.28 | ||
| Exports: | $20,587,316,314,112.00 | ||
| Imports: | $21,545,288,204,288.00 | ||
| Trade Net: | -957,971,890,176.00 | ||
| Tampere sub-region Non Market Statistics ? Evasion, Black Market, Barter & Crime | |||
| Black & Grey Markets Combined: | $186,313,248,755,387.31 | ||
| Avg Annual Criminal's Income / Savings: ? | $39,526.42 | ||
| Recovered Product + Fines & Fees: | $23,754,939,216,311.88 | ||
| Black Market & Non Monetary Trade: | |||
| Guns & Weapons: | $7,875,950,097,168.21 | ||
| Drugs and Pharmaceuticals: | $6,949,367,732,795.48 | ||
| Extortion & Blackmail: | $13,435,444,283,404.58 | ||
| Counterfeit Goods: | $18,763,292,878,547.78 | ||
| Trafficking & Intl Sales: | $2,316,455,910,931.83 | ||
| Theft & Disappearance: | $6,022,785,368,422.75 | ||
| Counterfeit Currency & Instruments : | $18,300,001,696,361.41 | ||
| Illegal Mining, Logging, and Hunting : | $3,243,038,275,304.56 | ||
| Basic Necessitites : | $6,022,785,368,422.75 | ||
| School Loan Fraud : | $6,949,367,732,795.48 | ||
| Tax Evasion + Barter Trade : | $80,114,696,964,816.55 | ||
| Tampere sub-region Total Market Statistics ? | |||
| National Currency: | rupee | ||
| Exchange Rates: | 1 rupee = $0.99 | ||
| $1 = 1.01 rupees | |||
| Regional Exchange Rates | |||
| Gross Domestic Product: | $53,262,100,000,000.00 - 22% | ||
| Black & Grey Markets Combined: | $186,313,248,755,387.31 - 78% | ||
| Real Total Economy: | $239,575,348,755,387.31 | ||
| Sub regions of Finland Economic Statistics & Links | |||
| Gross Regional Product: | $11,626,182,265,012,224 | ||
| Region Wide Imports: | $1,485,902,991,851,520 | ||
| Largest Regional GDP: | Keuruu sub-region | ||
| Largest Regional Importer: | Keuruu sub-region | ||
| Regional Search Functions: | All Sub regions of Finland Nations. | ||
| Regional Nations by GDP | Regional Trading Leaders | |||
| Regional Exchange Rates | WA Members | |||
| Returns to standard Version: | FAQ | About | About | 636,360,768 uses since September 1, 2011. | |
Version 3.69 HTML4. V 0.7 is HTML1. |
Like our Calculator? Tell your friends for us... |