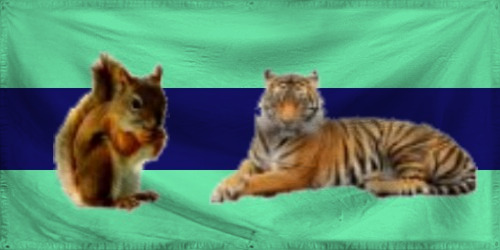
The Empire of Squirrels and Tigers
You Can't Stop Progress
Region: Blautaivia
Quicksearch Query: Squirrels and Tigers
|
Quicksearch: | |
NS Economy Mobile Home |
Regions Search |
Squirrels and Tigers NS Page |
|
| GDP Leaders | Export Leaders | Interesting Places BIG Populations | Most Worked | | Militaristic States | Police States | |

You Can't Stop Progress
Region: Blautaivia
Quicksearch Query: Squirrels and Tigers
| Squirrels and Tigers Domestic Statistics | |||
|---|---|---|---|
| Government Category: | Empire | ||
| Government Priority: | Social Welfare | ||
| Economic Rating: | Good | ||
| Civil Rights Rating: | Good | ||
| Political Freedoms: | Good | ||
| Income Tax Rate: | 28% | ||
| Consumer Confidence Rate: | 0% | ||
| Worker Enthusiasm Rate: | 0% | ||
| Major Industry: | Information Technology | ||
| National Animal: | squirreltiger | ||
| Squirrels and Tigers Demographics | |||
| Total Population: | 7,255,000,000 | ||
| Criminals: | inf | ||
| Elderly, Disabled, & Retirees: | 0 | ||
| Military & Reserves: ? | 197,882,483 | ||
| Students and Youth: | 1,242,056,000 | ||
| Unemployed but Able: | 1,178,897,257 | ||
| Working Class: | 2,800,336,955 | ||
| Squirrels and Tigers Government Budget Details | |||
| Government Budget: | $0.00 | ||
| Government Expenditures: | $0.00 | ||
| Goverment Waste: | $0.00 | ||
| Goverment Efficiency: | 0% | ||
| Squirrels and Tigers Government Spending Breakdown: | |||
| Administration: | $0.00 | 8% | |
| Social Welfare: | $0.00 | 13% | |
| Healthcare: | $0.00 | 9% | |
| Education: | $0.00 | 8% | |
| Religion & Spirituality: | $0.00 | 12% | |
| Defense: | $0.00 | 11% | |
| Law & Order: | $0.00 | 12% | |
| Commerce: | $0.00 | 1% | |
| Public Transport: | $0.00 | 8% | |
| The Environment: | $0.00 | 3% | |
| Social Equality: | $0.00 | 4% | |
| Squirrels and TigersWhite Market Economic Statistics ? | |||
| Gross Domestic Product: | $0.00 | ||
| GDP Per Capita: | $0.00 | ||
| Average Salary Per Employee: | $0.00 | ||
| Unemployment Rate: | 26.20% | ||
| Consumption: | $0.00 | ||
| Exports: | $0.00 | ||
| Imports: | $0.00 | ||
| Trade Net: | 0.00 | ||
| Squirrels and Tigers Non Market Statistics ? Evasion, Black Market, Barter & Crime | |||
| Black & Grey Markets Combined: | $nan | ||
| Avg Annual Criminal's Income / Savings: ? | $nan | ||
| Recovered Product + Fines & Fees: | $nan | ||
| Black Market & Non Monetary Trade: | |||
| Guns & Weapons: | $nan | ||
| Drugs and Pharmaceuticals: | $nan | ||
| Extortion & Blackmail: | $nan | ||
| Counterfeit Goods: | $nan | ||
| Trafficking & Intl Sales: | $nan | ||
| Theft & Disappearance: | $nan | ||
| Counterfeit Currency & Instruments : | $nan | ||
| Illegal Mining, Logging, and Hunting : | $nan | ||
| Basic Necessitites : | $nan | ||
| School Loan Fraud : | $nan | ||
| Tax Evasion + Barter Trade : | $nan | ||
| Squirrels and Tigers Total Market Statistics ? | |||
| National Currency: | mark | ||
| Gross Domestic Product: | $0.00 - nan% | ||
| Black & Grey Markets Combined: | $nan - nan% | ||
| Real Total Economy: | $nan | ||
| Blautaivia Economic Statistics & Links | |||
| Gross Regional Product: | $0 | ||
| Region Wide Imports: | $0 | ||
| Largest Regional GDP: | Hurricane MCLXIII | ||
| Largest Regional Importer: | Hurricane MCLXIII | ||
| Regional Search Functions: | All Blautaivia Nations. | ||
| Regional Nations by GDP | Regional Trading Leaders | |||
| Regional Exchange Rates | WA Members | |||
| Returns to standard Version: | FAQ | About | About | 594,253,973 uses since September 1, 2011. | |
Version 3.69 HTML4. V 0.7 is HTML1. |
Like our Calculator? Tell your friends for us... |