The Republic of Sea of Ringil
Things explode
Region: The catholic military orders
Quicksearch Query: Sea of Ringil
|
Quicksearch: | |
NS Economy Mobile Home |
Regions Search |
Sea of Ringil NS Page |
|
| GDP Leaders | Export Leaders | Interesting Places BIG Populations | Most Worked | | Militaristic States | Police States | |
Things explode
Region: The catholic military orders
Quicksearch Query: Sea of Ringil
| Sea of Ringil Domestic Statistics | |||
|---|---|---|---|
| Government Category: | Republic | ||
| Government Priority: | Religion & Spirituality | ||
| Economic Rating: | Very Strong | ||
| Civil Rights Rating: | Frightening | ||
| Political Freedoms: | Few | ||
| Income Tax Rate: | 9% | ||
| Consumer Confidence Rate: | 99% | ||
| Worker Enthusiasm Rate: | 100% | ||
| Major Industry: | Uranium Mining | ||
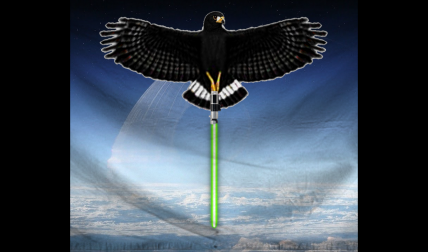
| National Animal: | hawk | ||
| Sea of Ringil Demographics | |||
| Total Population: | 10,262,000,000 | ||
| Criminals: | 1,264,076,925 | ||
| Elderly, Disabled, & Retirees: | 1,410,642,022 | ||
| Military & Reserves: ? | 330,790,182 | ||
| Students and Youth: | 1,678,863,200 | ||
| Unemployed but Able: | 1,667,518,078 | ||
| Working Class: | 3,910,109,593 | ||
| Sea of Ringil Government Budget Details | |||
| Government Budget: | $30,014,682,689,605.47 | ||
| Government Expenditures: | $27,613,508,074,437.03 | ||
| Goverment Waste: | $2,401,174,615,168.44 | ||
| Goverment Efficiency: | 92% | ||
| Sea of Ringil Government Spending Breakdown: | |||
| Administration: | $2,209,080,645,954.96 | 8% | |
| Social Welfare: | $2,485,215,726,699.33 | 9% | |
| Healthcare: | $2,485,215,726,699.33 | 9% | |
| Education: | $2,209,080,645,954.96 | 8% | |
| Religion & Spirituality: | $5,798,836,695,631.78 | 21% | |
| Defense: | $3,589,756,049,676.81 | 13% | |
| Law & Order: | $4,694,296,372,654.30 | 17% | |
| Commerce: | $276,135,080,744.37 | 1% | |
| Public Transport: | $2,209,080,645,954.96 | 8% | |
| The Environment: | $276,135,080,744.37 | 1% | |
| Social Equality: | $828,405,242,233.11 | 3% | |
| Sea of RingilWhite Market Economic Statistics ? | |||
| Gross Domestic Product: | $0.00 | ||
| GDP Per Capita: | $0.00 | ||
| Average Salary Per Employee: | $0.00 | ||
| Unemployment Rate: | 26.20% | ||
| Consumption: | $138,731,009,993,605.12 | ||
| Exports: | $21,003,258,298,368.00 | ||
| Imports: | $21,003,258,298,368.00 | ||
| Trade Net: | 0.00 | ||
| Sea of Ringil Non Market Statistics ? Evasion, Black Market, Barter & Crime | |||
| Black & Grey Markets Combined: | $44,836,172,574,014.46 | ||
| Avg Annual Criminal's Income / Savings: ? | $2,955.79 | ||
| Recovered Product + Fines & Fees: | $5,716,612,003,186.84 | ||
| Black Market & Non Monetary Trade: | |||
| Guns & Weapons: | $2,034,706,144,190.17 | ||
| Drugs and Pharmaceuticals: | $2,620,032,569,231.18 | ||
| Extortion & Blackmail: | $1,003,416,728,641.73 | ||
| Counterfeit Goods: | $2,731,523,316,858.04 | ||
| Trafficking & Intl Sales: | $2,118,324,204,910.32 | ||
| Theft & Disappearance: | $1,337,888,971,522.30 | ||
| Counterfeit Currency & Instruments : | $3,511,958,550,246.05 | ||
| Illegal Mining, Logging, and Hunting : | $557,453,738,134.29 | ||
| Basic Necessitites : | $1,616,615,840,589.45 | ||
| School Loan Fraud : | $947,671,354,828.30 | ||
| Tax Evasion + Barter Trade : | $19,279,554,206,826.22 | ||
| Sea of Ringil Total Market Statistics ? | |||
| National Currency: | rubledollar | ||
| Gross Domestic Product: | $0.00 - 0% | ||
| Black & Grey Markets Combined: | $44,836,172,574,014.46 - 100% | ||
| Real Total Economy: | $44,836,172,574,014.46 | ||
| The catholic military orders Economic Statistics & Links | |||
| Gross Regional Product: | $215,551,386,245,398,528 | ||
| Region Wide Imports: | $29,187,927,728,717,824 | ||
| Largest Regional GDP: | Outer Bele Levy Epies | ||
| Largest Regional Importer: | Outer Bele Levy Epies | ||
| Regional Search Functions: | All The catholic military orders Nations. | ||
| Regional Nations by GDP | Regional Trading Leaders | |||
| Regional Exchange Rates | WA Members | |||
| Returns to standard Version: | FAQ | About | About | 639,043,831 uses since September 1, 2011. | |
Version 3.69 HTML4. V 0.7 is HTML1. |
Like our Calculator? Tell your friends for us... |