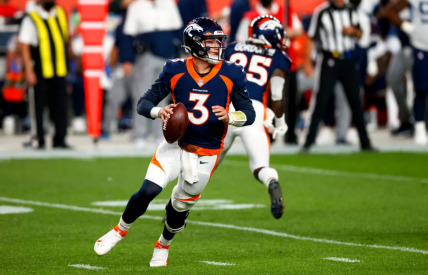
The Quarterback of QB Drew Lock
Celebrating the NFL
Region: New York Giants
Quicksearch Query: QB Drew Lock
|
Quicksearch: | |
NS Economy Mobile Home |
Regions Search |
QB Drew Lock NS Page |
|
| GDP Leaders | Export Leaders | Interesting Places BIG Populations | Most Worked | | Militaristic States | Police States | |

Celebrating the NFL
Region: New York Giants
Quicksearch Query: QB Drew Lock
| QB Drew Lock Domestic Statistics | |||
|---|---|---|---|
| Government Category: | Quarterback | ||
| Government Priority: | Defence | ||
| Economic Rating: | Very Strong | ||
| Civil Rights Rating: | Few | ||
| Political Freedoms: | Few | ||
| Income Tax Rate: | 36% | ||
| Consumer Confidence Rate: | 97% | ||
| Worker Enthusiasm Rate: | 98% | ||
| Major Industry: | Retail | ||
| National Animal: | unicorn | ||
| QB Drew Lock Demographics | |||
| Total Population: | 5,170,000,000 | ||
| Criminals: | 549,377,429 | ||
| Elderly, Disabled, & Retirees: | 651,651,609 | ||
| Military & Reserves: ? | 273,392,584 | ||
| Students and Youth: | 910,954,000 | ||
| Unemployed but Able: | 779,745,426 | ||
| Working Class: | 2,004,878,951 | ||
| QB Drew Lock Government Budget Details | |||
| Government Budget: | $32,702,705,676,299.80 | ||
| Government Expenditures: | $30,086,489,222,195.81 | ||
| Goverment Waste: | $2,616,216,454,103.98 | ||
| Goverment Efficiency: | 92% | ||
| QB Drew Lock Government Spending Breakdown: | |||
| Administration: | $3,008,648,922,219.58 | 10% | |
| Social Welfare: | $1,805,189,353,331.75 | 6% | |
| Healthcare: | $3,008,648,922,219.58 | 10% | |
| Education: | $2,707,784,029,997.62 | 9% | |
| Religion & Spirituality: | $0.00 | 0% | |
| Defense: | $6,017,297,844,439.16 | 20% | |
| Law & Order: | $4,813,838,275,551.33 | 16% | |
| Commerce: | $3,610,378,706,663.50 | 12% | |
| Public Transport: | $2,406,919,137,775.67 | 8% | |
| The Environment: | $1,203,459,568,887.83 | 4% | |
| Social Equality: | $902,594,676,665.87 | 3% | |
| QB Drew LockWhite Market Economic Statistics ? | |||
| Gross Domestic Product: | $24,615,500,000,000.00 | ||
| GDP Per Capita: | $4,761.22 | ||
| Average Salary Per Employee: | $7,586.33 | ||
| Unemployment Rate: | 21.31% | ||
| Consumption: | $47,247,576,939,888.64 | ||
| Exports: | $9,810,328,993,792.00 | ||
| Imports: | $9,966,012,334,080.00 | ||
| Trade Net: | -155,683,340,288.00 | ||
| QB Drew Lock Non Market Statistics ? Evasion, Black Market, Barter & Crime | |||
| Black & Grey Markets Combined: | $85,957,978,913,402.33 | ||
| Avg Annual Criminal's Income / Savings: ? | $13,870.95 | ||
| Recovered Product + Fines & Fees: | $10,314,957,469,608.28 | ||
| Black Market & Non Monetary Trade: | |||
| Guns & Weapons: | $4,311,652,222,296.26 | ||
| Drugs and Pharmaceuticals: | $3,125,947,861,164.79 | ||
| Extortion & Blackmail: | $4,742,817,444,525.89 | ||
| Counterfeit Goods: | $8,192,139,222,362.90 | ||
| Trafficking & Intl Sales: | $2,155,826,111,148.13 | ||
| Theft & Disappearance: | $2,802,573,944,492.57 | ||
| Counterfeit Currency & Instruments : | $7,760,974,000,133.27 | ||
| Illegal Mining, Logging, and Hunting : | $1,724,660,888,918.50 | ||
| Basic Necessitites : | $2,586,991,333,377.76 | ||
| School Loan Fraud : | $2,371,408,722,262.94 | ||
| Tax Evasion + Barter Trade : | $36,961,930,932,763.00 | ||
| QB Drew Lock Total Market Statistics ? | |||
| National Currency: | mark | ||
| Exchange Rates: | 1 mark = $0.42 | ||
| $1 = 2.38 marks | |||
| Regional Exchange Rates | |||
| Gross Domestic Product: | $24,615,500,000,000.00 - 22% | ||
| Black & Grey Markets Combined: | $85,957,978,913,402.33 - 78% | ||
| Real Total Economy: | $110,573,478,913,402.33 | ||
| New York Giants Economic Statistics & Links | |||
| Gross Regional Product: | $1,363,486,491,803,648 | ||
| Region Wide Imports: | $181,190,258,589,696 | ||
| Largest Regional GDP: | Darren Waller | ||
| Largest Regional Importer: | Drew Lock | ||
| Regional Search Functions: | All New York Giants Nations. | ||
| Regional Nations by GDP | Regional Trading Leaders | |||
| Regional Exchange Rates | WA Members | |||
| Returns to standard Version: | FAQ | About | About | 579,381,162 uses since September 1, 2011. | |
Version 3.69 HTML4. V 0.7 is HTML1. |
Like our Calculator? Tell your friends for us... |