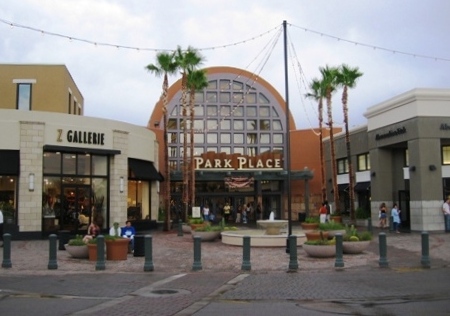
The Business of Park Place Mall
Park Place
Region: Tucson
Quicksearch Query: Park Place Mall
|
Quicksearch: | |
NS Economy Mobile Home |
Regions Search |
Park Place Mall NS Page |
|
| GDP Leaders | Export Leaders | Interesting Places BIG Populations | Most Worked | | Militaristic States | Police States | |
| Park Place Mall Domestic Statistics | |||
|---|---|---|---|
| Government Category: | Business | ||
| Government Priority: | Education | ||
| Economic Rating: | Frightening | ||
| Civil Rights Rating: | Very Good | ||
| Political Freedoms: | Average | ||
| Income Tax Rate: | 23% | ||
| Consumer Confidence Rate: | 106% | ||
| Worker Enthusiasm Rate: | 107% | ||
| Major Industry: | Retail | ||
| National Animal: | great white shark | ||
| Park Place Mall Demographics | |||
| Total Population: | 5,862,000,000 | ||
| Criminals: | 477,970,161 | ||
| Elderly, Disabled, & Retirees: | 681,280,778 | ||
| Military & Reserves: ? | 183,768,449 | ||
| Students and Youth: | 1,119,935,100 | ||
| Unemployed but Able: | 798,443,516 | ||
| Working Class: | 2,600,601,996 | ||
| Park Place Mall Government Budget Details | |||
| Government Budget: | $81,112,511,483,939.39 | ||
| Government Expenditures: | $77,868,011,024,581.81 | ||
| Goverment Waste: | $3,244,500,459,357.58 | ||
| Goverment Efficiency: | 96% | ||
| Park Place Mall Government Spending Breakdown: | |||
| Administration: | $4,672,080,661,474.91 | 6% | |
| Social Welfare: | $0.00 | 0% | |
| Healthcare: | $7,786,801,102,458.18 | 10% | |
| Education: | $21,024,362,976,637.09 | 27% | |
| Religion & Spirituality: | $0.00 | 0% | |
| Defense: | $8,565,481,212,704.00 | 11% | |
| Law & Order: | $12,458,881,763,933.09 | 16% | |
| Commerce: | $10,901,521,543,441.46 | 14% | |
| Public Transport: | $2,336,040,330,737.45 | 3% | |
| The Environment: | $10,122,841,433,195.64 | 13% | |
| Social Equality: | $0.00 | 0% | |
| Park Place MallWhite Market Economic Statistics ? | |||
| Gross Domestic Product: | $68,655,500,000,000.00 | ||
| GDP Per Capita: | $11,711.96 | ||
| Average Salary Per Employee: | $19,462.76 | ||
| Unemployment Rate: | 15.18% | ||
| Consumption: | $179,349,396,515,717.12 | ||
| Exports: | $31,834,713,358,336.00 | ||
| Imports: | $30,332,875,177,984.00 | ||
| Trade Net: | 1,501,838,180,352.00 | ||
| Park Place Mall Non Market Statistics ? Evasion, Black Market, Barter & Crime | |||
| Black & Grey Markets Combined: | $84,588,090,219,465.92 | ||
| Avg Annual Criminal's Income / Savings: ? | $14,318.25 | ||
| Recovered Product + Fines & Fees: | $10,150,570,826,335.91 | ||
| Black Market & Non Monetary Trade: | |||
| Guns & Weapons: | $2,333,616,232,974.63 | ||
| Drugs and Pharmaceuticals: | $4,985,452,861,354.88 | ||
| Extortion & Blackmail: | $4,242,938,605,408.41 | ||
| Counterfeit Goods: | $7,531,216,024,599.93 | ||
| Trafficking & Intl Sales: | $2,015,395,837,569.00 | ||
| Theft & Disappearance: | $2,121,469,302,704.21 | ||
| Counterfeit Currency & Instruments : | $5,834,040,582,436.57 | ||
| Illegal Mining, Logging, and Hunting : | $3,076,130,488,921.10 | ||
| Basic Necessitites : | $2,863,983,558,650.68 | ||
| School Loan Fraud : | $7,106,922,164,059.09 | ||
| Tax Evasion + Barter Trade : | $36,372,878,794,370.34 | ||
| Park Place Mall Total Market Statistics ? | |||
| National Currency: | dollar | ||
| Exchange Rates: | 1 dollar = $1.01 | ||
| $1 = 0.99 dollars | |||
| Regional Exchange Rates | |||
| Gross Domestic Product: | $68,655,500,000,000.00 - 45% | ||
| Black & Grey Markets Combined: | $84,588,090,219,465.92 - 55% | ||
| Real Total Economy: | $153,243,590,219,465.94 | ||
| Tucson Economic Statistics & Links | |||
| Gross Regional Product: | $1,429,293,041,188,864 | ||
| Region Wide Imports: | $195,349,826,240,512 | ||
| Largest Regional GDP: | Laxton | ||
| Largest Regional Importer: | Laxton | ||
| Regional Search Functions: | All Tucson Nations. | ||
| Regional Nations by GDP | Regional Trading Leaders | |||
| Regional Exchange Rates | WA Members | |||
| Returns to standard Version: | FAQ | About | About | 594,538,473 uses since September 1, 2011. | |
Version 3.69 HTML4. V 0.7 is HTML1. |
Like our Calculator? Tell your friends for us... |