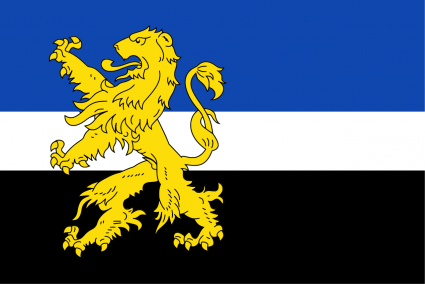
The Kingdom of Hilvarenbeek NLD
Kingdom of the Netherlands
Region: Aerospace
Quicksearch Query: Hilvarenbeek NLD
|
Quicksearch: | |
NS Economy Mobile Home |
Regions Search |
Hilvarenbeek NLD NS Page |
|
| GDP Leaders | Export Leaders | Interesting Places BIG Populations | Most Worked | | Militaristic States | Police States | |

Kingdom of the Netherlands
Region: Aerospace
Quicksearch Query: Hilvarenbeek NLD
| Hilvarenbeek NLD Domestic Statistics | |||
|---|---|---|---|
| Government Category: | Kingdom | ||
| Government Priority: | Law & Order | ||
| Economic Rating: | Frightening | ||
| Civil Rights Rating: | Some | ||
| Political Freedoms: | Some | ||
| Income Tax Rate: | 72% | ||
| Consumer Confidence Rate: | 102% | ||
| Worker Enthusiasm Rate: | 101% | ||
| Major Industry: | Arms Manufacturing | ||
| National Animal: | lion | ||
| Hilvarenbeek NLD Demographics | |||
| Total Population: | 5,840,000,000 | ||
| Criminals: | 351,511,930 | ||
| Elderly, Disabled, & Retirees: | 604,329,694 | ||
| Military & Reserves: ? | 287,717,229 | ||
| Students and Youth: | 1,186,688,000 | ||
| Unemployed but Able: | 700,415,910 | ||
| Working Class: | 2,709,337,237 | ||
| Hilvarenbeek NLD Government Budget Details | |||
| Government Budget: | $168,168,321,870,337.12 | ||
| Government Expenditures: | $158,078,222,558,116.88 | ||
| Goverment Waste: | $10,090,099,312,220.25 | ||
| Goverment Efficiency: | 94% | ||
| Hilvarenbeek NLD Government Spending Breakdown: | |||
| Administration: | $22,130,951,158,136.36 | 14% | |
| Social Welfare: | $4,742,346,676,743.51 | 3% | |
| Healthcare: | $11,065,475,579,068.18 | 7% | |
| Education: | $18,969,386,706,974.02 | 12% | |
| Religion & Spirituality: | $4,742,346,676,743.51 | 3% | |
| Defense: | $25,292,515,609,298.70 | 16% | |
| Law & Order: | $26,873,297,834,879.87 | 17% | |
| Commerce: | $23,711,733,383,717.53 | 15% | |
| Public Transport: | $4,742,346,676,743.51 | 3% | |
| The Environment: | $7,903,911,127,905.84 | 5% | |
| Social Equality: | $7,903,911,127,905.84 | 5% | |
| Hilvarenbeek NLDWhite Market Economic Statistics ? | |||
| Gross Domestic Product: | $128,154,000,000,000.00 | ||
| GDP Per Capita: | $21,944.18 | ||
| Average Salary Per Employee: | $31,674.08 | ||
| Unemployment Rate: | 8.36% | ||
| Consumption: | $59,123,861,458,780.16 | ||
| Exports: | $27,102,298,734,592.00 | ||
| Imports: | $26,619,502,657,536.00 | ||
| Trade Net: | 482,796,077,056.00 | ||
| Hilvarenbeek NLD Non Market Statistics ? Evasion, Black Market, Barter & Crime | |||
| Black & Grey Markets Combined: | $470,795,513,276,741.00 | ||
| Avg Annual Criminal's Income / Savings: ? | $115,063.95 | ||
| Recovered Product + Fines & Fees: | $60,026,427,942,784.48 | ||
| Black Market & Non Monetary Trade: | |||
| Guns & Weapons: | $19,609,089,211,129.75 | ||
| Drugs and Pharmaceuticals: | $16,975,032,451,425.75 | ||
| Extortion & Blackmail: | $33,950,064,902,851.50 | ||
| Counterfeit Goods: | $46,827,675,728,071.04 | ||
| Trafficking & Intl Sales: | $8,194,843,252,412.43 | ||
| Theft & Disappearance: | $14,048,302,718,421.31 | ||
| Counterfeit Currency & Instruments : | $45,656,983,834,869.26 | ||
| Illegal Mining, Logging, and Hunting : | $7,609,497,305,811.54 | ||
| Basic Necessitites : | $13,462,956,771,820.42 | ||
| School Loan Fraud : | $16,975,032,451,425.75 | ||
| Tax Evasion + Barter Trade : | $202,442,070,708,998.62 | ||
| Hilvarenbeek NLD Total Market Statistics ? | |||
| National Currency: | euro | ||
| Exchange Rates: | 1 euro = $1.38 | ||
| $1 = 0.73 euros | |||
| Regional Exchange Rates | |||
| Gross Domestic Product: | $128,154,000,000,000.00 - 21% | ||
| Black & Grey Markets Combined: | $470,795,513,276,741.00 - 79% | ||
| Real Total Economy: | $598,949,513,276,741.00 | ||
| Aerospace Economic Statistics & Links | |||
| Gross Regional Product: | $149,806,346,160,570,368 | ||
| Region Wide Imports: | $19,227,887,831,875,584 | ||
| Largest Regional GDP: | Cedar Park-TX- | ||
| Largest Regional Importer: | New Milford-CT- | ||
| Regional Search Functions: | All Aerospace Nations. | ||
| Regional Nations by GDP | Regional Trading Leaders | |||
| Regional Exchange Rates | WA Members | |||
| Returns to standard Version: | FAQ | About | About | 559,913,501 uses since September 1, 2011. | |
Version 3.69 HTML4. V 0.7 is HTML1. |
Like our Calculator? Tell your friends for us... |