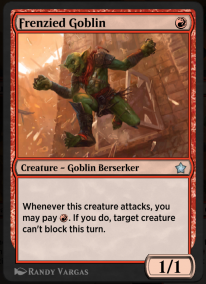
The Red Creature of Frenzied Goblin
Whenever this creature attacks, you may pay {R}. If you
Region: MTG TCG
Quicksearch Query: Frenzied Goblin
|
Quicksearch: | |
NS Economy Mobile Home |
Regions Search |
Frenzied Goblin NS Page |
|
| GDP Leaders | Export Leaders | Interesting Places BIG Populations | Most Worked | | Militaristic States | Police States | |

Whenever this creature attacks, you may pay {R}. If you
Region: MTG TCG
Quicksearch Query: Frenzied Goblin
| Frenzied Goblin Domestic Statistics | |||
|---|---|---|---|
| Government Category: | Red Creature | ||
| Government Priority: | Defence | ||
| Economic Rating: | Very Strong | ||
| Civil Rights Rating: | Rare | ||
| Political Freedoms: | Outlawed | ||
| Income Tax Rate: | 28% | ||
| Consumer Confidence Rate: | 95% | ||
| Worker Enthusiasm Rate: | 95% | ||
| Major Industry: | Arms Manufacturing | ||
| National Animal: | Card | ||
| Frenzied Goblin Demographics | |||
| Total Population: | 1,439,000,000 | ||
| Criminals: | 187,551,464 | ||
| Elderly, Disabled, & Retirees: | 157,355,362 | ||
| Military & Reserves: ? | 103,763,385 | ||
| Students and Youth: | 252,400,600 | ||
| Unemployed but Able: | 224,053,379 | ||
| Working Class: | 513,875,810 | ||
| Frenzied Goblin Government Budget Details | |||
| Government Budget: | $6,222,117,230,084.10 | ||
| Government Expenditures: | $4,977,693,784,067.28 | ||
| Goverment Waste: | $1,244,423,446,016.82 | ||
| Goverment Efficiency: | 80% | ||
| Frenzied Goblin Government Spending Breakdown: | |||
| Administration: | $497,769,378,406.73 | 10% | |
| Social Welfare: | $0.00 | 0% | |
| Healthcare: | $547,546,316,247.40 | 11% | |
| Education: | $547,546,316,247.40 | 11% | |
| Religion & Spirituality: | $49,776,937,840.67 | 1% | |
| Defense: | $1,393,754,259,538.84 | 28% | |
| Law & Order: | $846,207,943,291.44 | 17% | |
| Commerce: | $547,546,316,247.40 | 11% | |
| Public Transport: | $199,107,751,362.69 | 4% | |
| The Environment: | $248,884,689,203.36 | 5% | |
| Social Equality: | $149,330,813,522.02 | 3% | |
| Frenzied GoblinWhite Market Economic Statistics ? | |||
| Gross Domestic Product: | $3,890,080,000,000.00 | ||
| GDP Per Capita: | $2,703.32 | ||
| Average Salary Per Employee: | $4,440.80 | ||
| Unemployment Rate: | 23.35% | ||
| Consumption: | $14,043,650,174,484.48 | ||
| Exports: | $2,507,525,230,592.00 | ||
| Imports: | $2,502,857,588,736.00 | ||
| Trade Net: | 4,667,641,856.00 | ||
| Frenzied Goblin Non Market Statistics ? Evasion, Black Market, Barter & Crime | |||
| Black & Grey Markets Combined: | $19,449,155,153,681.89 | ||
| Avg Annual Criminal's Income / Savings: ? | $10,166.70 | ||
| Recovered Product + Fines & Fees: | $2,479,767,282,094.44 | ||
| Black Market & Non Monetary Trade: | |||
| Guns & Weapons: | $1,366,247,841,011.18 | ||
| Drugs and Pharmaceuticals: | $822,166,842,378.41 | ||
| Extortion & Blackmail: | $1,015,617,864,114.51 | ||
| Counterfeit Goods: | $2,031,235,728,229.02 | ||
| Trafficking & Intl Sales: | $338,539,288,038.17 | ||
| Theft & Disappearance: | $677,078,576,076.34 | ||
| Counterfeit Currency & Instruments : | $1,982,872,972,794.99 | ||
| Illegal Mining, Logging, and Hunting : | $338,539,288,038.17 | ||
| Basic Necessitites : | $338,539,288,038.17 | ||
| School Loan Fraud : | $652,897,198,359.33 | ||
| Tax Evasion + Barter Trade : | $8,363,136,716,083.21 | ||
| Frenzied Goblin Total Market Statistics ? | |||
| National Currency: | Mana | ||
| Exchange Rates: | 1 Mana = $0.32 | ||
| $1 = 3.16 Manas | |||
| Regional Exchange Rates | |||
| Gross Domestic Product: | $3,890,080,000,000.00 - 17% | ||
| Black & Grey Markets Combined: | $19,449,155,153,681.89 - 83% | ||
| Real Total Economy: | $23,339,235,153,681.89 | ||
| MTG TCG Economic Statistics & Links | |||
| Gross Regional Product: | $635,360,887,439,360 | ||
| Region Wide Imports: | $81,680,480,075,776 | ||
| Largest Regional GDP: | Shock MTG | ||
| Largest Regional Importer: | Shock MTG | ||
| Regional Search Functions: | All MTG TCG Nations. | ||
| Regional Nations by GDP | Regional Trading Leaders | |||
| Regional Exchange Rates | WA Members | |||
| Returns to standard Version: | FAQ | About | About | 590,485,493 uses since September 1, 2011. | |
Version 3.69 HTML4. V 0.7 is HTML1. |
Like our Calculator? Tell your friends for us... |